Decade Statistics: Favorites
The last post I want to do for my Decade Statistics week is a post of some of my favorite titles, tags, and survey responses. So let’s get to it!
Favorite Titles
- Complex analysis: it’s all fun and games until someone loses an i.
- A Dutch man once touched an electrically charged French Petri dish. It was a culture shock.
- Are disruptive anti-religious protestors weapons of mass destruction?
- Are Humorous Baristas called Brew-Ha-Has?
- Are invertebrates not allowed to drink Orange Crush?
- Are Leibniz’ fingerprints the best of all possible whorls?
- Are People In R.E.M. Sleep Losing Their Religion?
- Are people on the Atkins diet decarbohydrated?
- Are people who predict golf tournament wins considered fore-casters?
- Are the bulbs of mercury at the bottom of thermometers collectively known as H.G. Wells?
- Are Trivial Jackets just Petticoats?
- Aren’t clones technically carbon copies?
- Do auditioning court jesters have to provide a portFOOLio?
- Do babies deprived of disco exhibit a failure to jive?
- Do geology majors with honors graduate magma cum laude?
- Do ghosts enjoy Boo-lean algebra?
- Do hyperparameters have ADHD?
- Do Narcissistic Bookshelves post Shelfies?
- Do nervous guitarists fret a lot?
- Do obedient consonants respond to a Q queue cue?
- Do philosophy departments have Causal Fridays?
- Do physical comedians suffer from post-dramatic jest disorder?
- Does bread experience social loafing?
- Does Mother Nature drive a Fjord?
- Does |0| = −459.67?
- Had Lord Kelvin done nothing with his life, would he have been an “absolute zero”?
- If two hotels from the same company sleep together, is it considered inncest?
- Is a short spike in self-esteem considered a confidence interval?
- Is a theorem about pickles called a dill lemma?
- Is an admirable bakery product considered a roll model?
- Is Superman’s costume considered his strong suit?
- Would a passionate speech about horology be considered a glockenspiel?
- Of course someone’s always pushing the envelope. Otherwise it’s just stationery.
- Sun Tans: They Don’t Happen Overnight
- Are you ready for another emo Valentine’s Day blog? GOD KNOWS I AM
- Repressed sexual tension durng REM sleep? DON’T MIND IF I DO
- Stop whining or I will TURN THIS BLOG AROUND AND GO HOME
- Flu shots are BOGUS, I have the immune system of Zeus!
- I’m a colorless green idea, and I’m SLEEPING FURIOUSLY!!!!
- If Captain Planet isn’t your hero, you’re a COMMIE
- In Soviet Russia, handle flies off YOU!
- Swiggety swag, what’s in the ba-OH GOD BEES
- I AM ROOMBA HERE ME ROAR
- LET ME ‘SPLAIN YOU A THING, BRO:
- CLAUDIA’S INSANELY HYPER SURVEY OF INSANE HYPERNESS
- CRAIGSLIST YOU ARE MY ONLY COMPANION MAKE HOT SWEET LOVE TO ME YOUR PIC GETS MINE – 22 F
- HELLO GOOD SIR JUST STOPPING IN TO TELL YOU HOW AWESOME LEIBNIZ IS PIP PIP TALLY HO
- I LEFT MY HEART IN SAN FRANSISCO OH SHI—*collapses*
- TUKEY TUKEY BO BUKEY BANANA-FANA FO FUKEY ME MI MO MUKEY…TUKEY!
- *farting noises with mouth*
- Circular reasoning works because circular reasoning works because circular reasoning works…
- A Red Sea and its Better Half are Soon Parted
- I used to teach a failing fly-tying class until I realized my efforts were all for knot.
- I used to work at a bridal shop specializing in headdresses. My work there was to know a veil.
- My new position at the PepsiCo factory isn’t the greatest job in the world, but I’m making Dew
- If you want to eat an apple pie, you must first consume the universe
- In This Blog: Claudia Does a Dumb and Walks a Mile in -31 Degree Weather
- In This Blog: Claudia Drinks 16 oz of Red Bull and Tries to Write Shit
- Claudia the Bad Blogger Gives You YouTube Instead of Actual Content
- You can lead a Claudia to WordPress but you can’t make her update her blog
- “Don’t be afraid. I’m only a toaster. Plug me in. Go on. You’ll like it.”
- Some Days I Miss My Sanity. Other Days I’m Just a Toaster.
- “The Brave Little Toaster Goes to Mars” (or, “Salvador Dali Takes a Film Class”)
- Absolute Zero is a Government Conspiracy
- Emojis are dumb and so is your face
- Shel Silverstein’s “Where the Sidewalk Ends” is actually referring to every other block in Calgary
- Today was the Wrong Day to Wear Parachute Pants: A True Story
- “I just realized I’m illiterate and now I cacng apbtrtht kd thactgs”
- Facebook, you inconsistent freak show
- Don’t like product placement? Try an ice-cold Coca-Cola instead!
- Eminem is a rapper. M&M’s come in a wrapper. CONSPIRACY??
- Godot Divides by Zero
- Hello, I’m Erik Erikson and I have a silly name
- I love how Windows gets overly defensive when you try and move the location of the calculator
- I think Scooby Doo is in my pants
- In the beginning, Al Gore created http://
- It’s My Infinitive and I’ll Split It if I Want To!
- The Selfie of xXxDorainGray2000xXx
- Walk into the club like what up I got an infinite series
- When life gives you gators, make Gatorade
- Why doesn’t somebody buy Godot a watch?
- You say tomato, I say existential crisis
Favorite Tags
- “ENVIRO” IS NOT A WORD GODDAMMIT
- “stop bidding against me or I WILL INVADE YOU” is the fucking quote of the century don’t even argue with me
- (i’m not really a roomba i lied)
- *hand banana voice* “TNGHT…you.”
- ?!???!?!??!!?!?!
- at least my main man Leibniz is here for me
- australia u ok?
- blister party on toe 3 BYOB
- claudia bitches to the tubes
- claudia bitches about the tubes
- claudia bitches about the tubes to the tubes
- claudia goes on a date for the first time since the stone age
- dafuq do i tag this?
- dear god i hate twitter
- expressing anger in poem form is constructive right?
- friends don’t let friends purchase islands
- FROM BREADCRUMBS TO BUFF
- give us those flowers back you faker
- HAHA THOSE POOR SOGGY BASTARDS
- holy shit i used the “sports” tag
- i don’t get it gary (random spongebob reference for effect)
- i hate this goddamn font with all my soul
- i mean seriously how can not a single store in vancouver have bisquik
- I’m gonna sum some terms / only got an infinite number to figure / I’m I’m addin’ / don’t be lookin’ saddened / this is Maclaurin’s series (sung to the chorus of Macklemore’s “Thrift Shop”)
- I’ve used the “cap’n crunch” tag more than once?!
- let it go…let it go…it was fucking five years ago
- look at that worthless pie chart i mean seriously
- loop the loop take a poop
- MANLY SEAGULL IS MANLY
- mayans NO!
- OH GOD I HAVE TO TAG THIS?! poetry? is this poetry? i’m muthafuckin’ wordsworth
- OH WHAT IN THE HOT HOLY FUZZ FUCK IS THIS NOW
- revenge is a dish best served at 200 dB
- rise on the third day fungus jesus
- shit u dead son
- SUMMER DAYS DRIFTING AWAY TO OH OH THOSE SUMMER NIGHTS WELL-A-WELL-A-WELL-A HUH!
- SWIGGITY SWAG WHAT’S IN THE TAG?
- take that you damn fog
- the day we completely give up the ability to flush manually is the day we lose our dignity
- the state the state the state is on fire/we could really use some water
- what in the flying fuck of fucks
- yes i just used “penis costumes” as a tag what’re you gonna do about it?
- you and me baby ain’t nothin’ but aves so let’s do it on the porch until we make tons of babies (sung to the chorus of The Bloodhound Gang’s “The Bad Touch”)
Favorite Survey Responses
219.Have you ever seen The Exorcist?
Yeah, he lives down the block
Two Things You Want Very Badly At The Moment:
1. A Pulitzer Prize
2. A taco
1. Are you in a relationship?: With my Tests and Measurements class. Yes, we’re a couple now. Yes, I’m seeking therapy for this.
31. Would you be a pirate?
Do you have any idea how many “booty” jokes I would be making? I would be ordered to walk the plank within my first half hour.
2. Shorter than 5’3″?
Shut up! You don’t know me! You can’t judge me!
3. In your pajamas?
No, actually, I’m 5’4″ in my pajamas.
11. DO YOU HAVE INTENSELY ROMANTIC DREAMS INVOLVING JOHN PHILIP SOUSA?
How…how did you know?
When/where was the last photograph you took?
Monday, in the SUB, for my “official” summer custodian badge thingy. Like there are going to be random people bursting into the apartments we’re cleaning and demanding to see proof that we’re supposed to be cleaning them.
Dude, that would make work so much more interesting.
*BAM* “WHERE ARE YOUR PROOFS OF IDENTIFICATION, YOU GSR-CLEANING HOOLIGANS?”
Who would clean these stupid rooms for fun, anyway? “Hey, it’s some idle Tuesday afternoon, let’s go break into the GSR and clean it!”
Has anyone touched/smacked your butt?
It’s called Marching Band. Actually, it’s called Beau the Pervert, but it usually goes on during marching band, so I’m calling it that.
Are you happy with your life right now?
*makes farting noises with mouth*
Are you strong enough for this survey?
I AM JESUS
Do you put shampoo in your left or right hand?
I put it in my hair. Shampoo is for hair.
How do you feel about Diet Dr Pepper?
It makes me SO ANGRY
What is something silly you’ve kept for sentimental reasons?
My sanity.
318. If there was a god and you could ask him/her one question what would it be?
“Why is Jesus delusional about the moon?”
1804. Where do snowflakes come from?
God forgot to buy Head and Shoulders at Walmart last time he went.
1423. Are you jealous that dog can lick their own genitals?
Hahahahahaha.
If you could do that would you ever leave the house?
I think I would get sick of licking my genitals pretty quickly.
And that is probably one of the strangest sentences I’ve ever written.
1112. What rhymes with ‘orange’?
Stenographer.
7. how high is your sperm count?
Hopefully very, very, very low.
984. What do you think of the Insane Clown Posse?
Fuckin’ posses, how do they work?
737. Do you know how heavy things like airplanes stay in the air?
Fuckin’ aerodynamics, how do they work?
753. When Jesus saves souls…does he trade them in for valuable prizes?
It takes a metric ton of souls to trade in for a resurrection. That’s why it took him three days.
3322. Why does the cheese stand alone?
Because that’s just its whey.
3369. Can you mashed potatoe?
Only if I’m Dan Quayle.
2367. What is the official language of Australia?
Canadian.
2588. Winkin, Blinkin and Nod, one night, sailed off in a sea of dew…
They had a fight with potato guns, pew pew pew pew pew! (I don’t know).
2692. If you are making out with someone and you reach down and find they have a fish tail instead of legs do you still fool around with them?
How did I not notice this pre-makeout?
4721. Why are so many letters silent in French?
Why pick on French? Why can’t English make up its mind about how to pronounce stuff? Why doesn’t English get cool little letter accents like other languages. HOW DOES SOMEONE WITH PARASIGMATISM EXPLAIN THEIR SPEECH IMPEDIMENT?!
4347. What would you do if there were no limits?
Reach the asymptote. HA MATH JOKE
4121. Is there a book inside of you?
I EAT PAPERBACKS FOR BREAKFAST
4021. Write a poem right here in five minutes or less:
Roses are red
Violets are blue
Datum means one
Data means two.
3684. Why is jesus always pictured as white when he came from the middle east and was probably middle eastern?
Making him white makes him automatically tortilla-colored for easy burrito appearances.
19: Are you a vegetarian?
I EAT SOULS
53: How often do you forget to close your parentheses?
NEVER! (Well, almost never (ha you see what I did there (oh god it doesn’t stop (FOR THE LOVE OF JEEBUS MAKE IT STOP
X) Do you think you’re a good person?
I’m a toaster.
Z) What do you usually eat for breakfast?
Souls.
When your pet comes in the room, do you say hi or just ignore them?
Each cat gets about a five-minute greeting.
34. Could you forgive a cheater?
HAHAHA, I thought that read, “could you forgive a cheddar” and I was like NO, cheddar is the asshole of the cheese world. He will take your gouda day and ruin it in the worst whey.
Favorite scent?
The sound of one hand clapping.
41: What do you do when characters don’t follow the outline?
I HAVE NO OUTLINE. I AM GODBERRY: KING OF THE PLOT
24. What do you want God to say to you when you reach the pearly gates?
“Leibniz is sitting over there.”
37. if you had one wish, what would you wish for?
Leibniz. Alive, naked, and on my bed.
If you had the chance to travel back in time, would you?
Dude, you have no idea. Leibniz. Alive. Naked.
3731. What would make a cool coffee table book?
“1,001 Pictures of Naked Leibniz Doing Calculus”
4385. Name three highly specific things you look for in a potential mate?
Like, how specific is specific?
1. They wear a giant badass wig.
2. They invented calculus.
3. Their first name is Gottfried.
40: What historical figure would you like to have sex with?
Leibniz. INTEGRATION BY PARTS okay I’ll stop.
If you could steal one thing without consequence what would it be?
Probably something Leibniz-related. Like Leibniz. DON’T JUDGE ME.
If you could eat lunch with one famous person, who would it be?
LEIBNIZ I DON’T CARE THAT HE’S DEAD BRING ME HIS URN I’LL BUY IT A SANDWICH
16. What’s something you want to do that you’d be embarrassed to tell other people about?
I would make sweet, hot love to Gottfried Leibniz, 100% not kidding. HAHA OH WAIT I’M NOT EMBARRASSED TO TELL PEOPLE ABOUT THAT AT ALL.
That’s like how I start my conversations now.
“Hi, nice to meet you. I’m in love with a dead polymath and his incredible wig!”
Here’s to another decade of blogging!
Decade Statistics: Popular Posts and Weird Searches
Aloha, fools! Today’s Decade Statistics topics involve some of the weird ways people find my blog and which of my posts seem to be the most popular. These stats are going to be a bit skewed, ‘cause of my move over to WordPress from MySpace in 2010. But let’s just work with the WordPress data because MySpace is dead and nobody cares about pre-2010, anyway. Okay?
Ten Most Popular Posts on WordPress (2010 – 2016)
- Colored Beats!
- Multicollinearity: The Silent Killer
- Scrabble Letter Values and the QWERTY Keyboard
- The Periodic Table of Academic Disciplines
- TWSB: And here’s some eye surgery to creep you out for the rest of your life
- You’re the Na to my Cl
- Oh look, PayPal wants me to fill out a survey
- Gift of the Magikarp
- Adventures in R: Creating A Pseudo-CDF Plot for Binary Data
- Snow White and the Seven Dwarfs is like a bad drug trip
Weirdest Search Terms on WordPress (2010 – 2016)
- jokes about leibniz cookies
- costco underwear
- man with foot on stool playing tambourine pics
- steve torso
- boastful toast is the toast with the most to lose
- thomas m disch, toaster (I like to think that the “toaster” part is Disch’s title, like how people put “PhD” at the end of a name. “Thomas M. Disch, Toaster.” I like it.)
- hipster balloons
- third degree noodle trauma
- if your a noodle and you know it clap your hands
- can’t get chitty chitty bang bang songs out of my head
- chitty chitty bang bang rule 34 (INTERNET, NO)
- how big is 100 grams of maize porridge
- dopey’s butt
- limber up and let me know that i am santa english
- kgdlfhlo
- gdrydfjgki
- khkjhkhkjhkjh
- nnnnnnnnnnng0
- czzxc
- asdfgh
- daadadad
- ppppppppppppppppppppppppppppppppppppppppppppppp
Yeah.
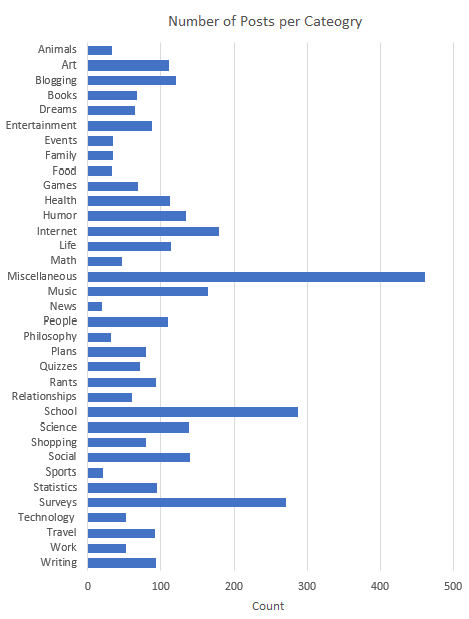
Decade Statistics: Categories
Hello again! Today we’re going to be talking about my blog categories. There are a total of 35 of them, and they break down as follows:
Posts per category
Words per category

Average number of words per post, by category

The “Surveys” category has such a high average (and total) word count because of my doing the 5,000 question survey in increments of 100 questions at a time, haha.
I’ll also give you my favorite post in each category, because I’m that exciting.
Animals: Asp caterpillars, aka Donald Trump in caterpillar form.
Art: A Flash I did about Millard Fillmore. It’s horrifically bad, which makes it fantastic. (Seriously, it’s so freaking bad.)
Blogging: I justify why my blog is important to me.
Books: I buy a copy of The Brave Little Toaster (book version) and gush about its awesomeness.
Dreams: Big Advertising vs. the Unbranded Man meet in an epic Grand Canyon showdown.
Entertainment: Our 7th grade reading group’s interpretation of Dune.
Events: Pictures from downtown Vancouver during the 2010 winter Olympics!
Family: My ancestry composition according to 23andMe.
Food: Tukey Sandwiches. Because statisticians deserve more food items named after them. Also, puns.
Games: A brief rambling about Gordon Freeman.
Health: My genetics and health risk factors, according to 23andMe.
Humor: What if the Founding Fathers communicated via chatroom? This is still my favorite blog post.
Internet: Holly Carp is real.
Life: 2009 me writes a letter to 2006 me.
Math: I explain what it’s like to struggle with doing mental calculations.
Miscellaneous: I accidentally inhale a bee and suffer predicable consequences.
Music: I re-write MC Hammer lyrics to be about proofs. ‘Cause that’s what you do when you’ve got a 25 credit semester to deal with.
News: Vancouver sucks.
People: A post about Leibniz. Shocking, huh?
Philosophy: I talk about why I think polymathy isn’t a thing that happens anymore.
Plans: What I would do if I won the lottery.
Quizzes: I discuss an in-depth aptitude test I took in 2005.
Rants: I spiral into a rage-induced rant triggered by Google.
Relationships: A blog about sex and a thing that happened to me once. [this used to be private, but I made it public because I think it’s important.]
School: What I learned during my first round of undergrad.
Science: The stability of a stool is analogous to the “stability” of a structural equation model.
Shopping: How many iPods can I buy?
Social: Sean ponders the purchase of an island.
Sports: The inanity of basketball team names.
Statistics: Nate and I play around with the standard deviation.
Surveys: I lie a lot.
Technology: Claudia vs. Apple stores.
Travel: Bad directions and big trees.
Work: Teaching intro stats to non-stats people is important to me.
Writing: An essay on concurrent discoveries throughout history, focusing mainly on calculus.
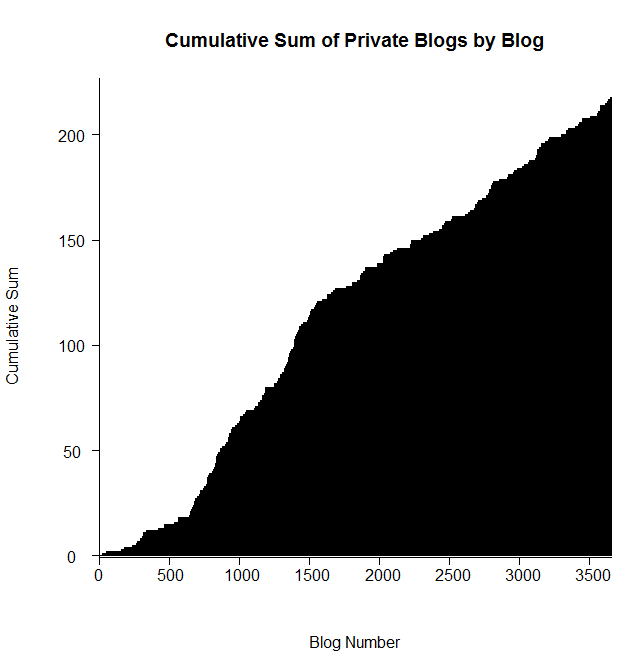
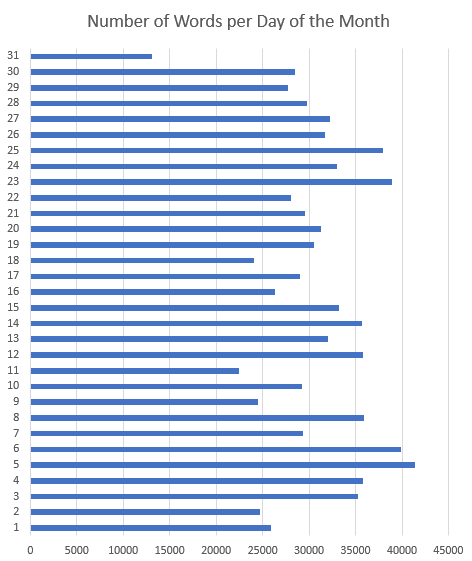
Decade Statistics: Totals and Words
Hello, everyone! So today I’m going to be talking about totals and word counts and whatnot. So let’s do it!
Total number of blog posts: 3,653
Total words: 952,384
Total number of images: 1,839
Total number of videos: 603
Total number of private blog posts: 218
Cumulative sums!


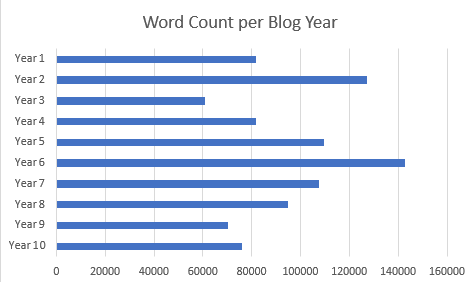
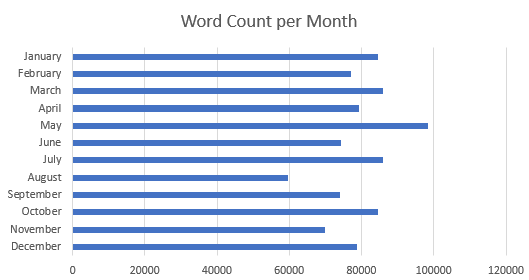
Word counts per blog year, month, day of the week, and (why not) day of the month:

And, just for fun, a word cloud of my titles.

YAY!
Decade Statistics: Timeline and Milestones
Hey, guys!
So in honor of my decade of blogging, this week will be all about blog stats and such. I figured the best way to start off would be to go through each blogging year and make note of the “highlights” of the past decade. So here you go!
Year 1 (May 2006 – April 2007)
- Started blogging (duh)
- Graduated high school
- Took a cruise to Alaska
- Got my wisdom teeth removed
- Attended band camp for the U of I marching band
- Met two of my best college friends: Matt and Maggie
- Started college
- Met Sean
- Joined Facebook
- The Butt Song made its debut
- A (really crappy) play I wrote was performed in my theatre class
- I took Literature in Western Civilization II and realized that I wanted to study philosophy in more detail
Year 2 (May 2007 – April 2008)
- Went to a drag show, in drag, with Matt
- Started dating Matt at said drag show
- Got hired at my first part-time job: Wendy’s
- I took Tests and Measurements (PSYC 453) and realized that psychometrics was the area of psychology that interested me the most
- The 25-credit semester
- I spent most nights talking to Sean on MSN Messenger, usually until at least 1 AM
- Discovered Leibniz
- First date with Rob and all the subsequent Rob/Jessica drama that entailed
Year 3 (May 2008 – April 2009)
- Worked at the U of I as a summer custodian
- Discovered Metalocalypse
- Moved into the house with Sean, Aaron, Lanky, and Michael
- So much Rock Band
- Got my industrial ear piercing
- Broke up with Rob and dealt with all the drama that entailed
- Got to march a halftime show for the Seattle Seahawks
- Started dating Aaron
- Went to Hawaii with the band
- Went parasailing in Hawaii
- Got my B.S. in psychology
- Got accepted into UBC’s psychology graduate program
- Turned 21
Year 4 (May 2009 – April 2010)
- Got my B.S. in philosophy
- “Broke up” with Aaron (I use quotes because it was the most mutual, amicable break up there could ever be)
- Worked as an in-home caretaker for Seubert’s
- Took another cruise to Alaska
- I…did stuff. This is still private, but it’s worth mentioning because it’s important to me and I think at least one of you knows what I’m talking about
- Moved out of the house with the guys
- Moved to Vancouver
- Started grad school
- Realized my supervisor and I were not the most compatible of people
- Lots and lots of misery
- Lots and lots of rain
- NO REALLY IT RAINED THE WHOLE GODDAMN MONTH OF NOVEMBER I AM NOT EXAGGERATING I KNOW THIS REALLY ISN’T A BIG DEAL IN THE GRAND SCHEME OF THINGS BUT I MEAN SERIOUSLY WHAT IN THE SOGGY FUCK, VANCOUVER
- Won NaNoWriMo 2009
- Started downloading a new song per day
- The 2010 Olympics came to Vancouver. I walked around downtown and got to see the Olympic torch
Year 5 (May 2010 – April 2011)
- Moved to a new apartment in Vancouver
- Went to Boston for the APS conference
- Moved my blog from MySpace to WordPress
- Started walking for pleasure
- Won NaNoWriMo 2010
- Decided not to continue on to the PhD program at UBC
- Got accepted into the philosophy graduate program at UWO
- Went skydiving
- Thesis drama
- Was hospitalized for…reasons
- Ran a 10K (Vancouver Sun Run)
Year 6 (May 2011 – April 2012)
- I got really sick, both mentally and physically
- Was hospitalized again for…different reasons
- Successfully defended my thesis
- Got my M.A. in psychology
- Moved back to Moscow
- Took ANOTHER cruise to Alaska
- Saw Mount Rushmore
- Moved to London, Ontario
- Started grad school (again)
- Quit grad school (again) and moved back to Moscow
- Won NaNoWriMo 2011
- Moved to Marana, AZ to be with my mom
- Moved to Tucson, AZ with my mom
- Started working at Pima Community College as a Disabled Student Resources tech
Year 7 (May 2012 – April 2013)
- Moved back to Moscow
- Started working as a lecturer for the UI stats department
- Went back to undergrad
- Won NaNoWriMo 2012
- Worked as a data analyst for the Ag Department
Year 8 (May 2013 – April 2014)
- Had what was probably my most enjoyable semester at UI
- Walked 1,361.2 miles in 2013
- Got accepted into the University of Calgary’s statistics graduate program
Year 9 (May 2014 – April 2015)
- Got my B.S. in math
- Had to unexpectedly choose between University of Calgary and Carleton University for grad school
- Chose the University of Calgary and moved up there
- Met Nate and subsequently fell head over heels for him
- Won NaNoWriMo 2014
- Won a TA award for fall 2014
Year 10 (May 2015 – April 2016)
- Saw some of the oldest/biggest trees on the planet in the Grove of Titans in Jedediah State Park
- Went to my first MLB game and saw the Giants play the Braves at AT&T Park in San Francisco
- Saw the Grand Canyon for the first time
- Visited Yellowstone National Park
- Moved in with Nate
- Adopted Jazzy Cat
- Nate and I got engaged
- Walked 2,523.29 miles in 2015
- Won a TA award for fall 2015
- PhD program drama
- Blogged for 10 years straight!
Man, a lot of stuff can happen in a decade. Writing it all out like this makes it seem like I’ve really become a completely different person from the person I was when I first started this blog. Pretty snazzy, if you ask me.
Adventures in R: Creating a Pseudo-CDF Plot for Binary Data
(Alternate title: “Ha, I’m Dumb”)
(Alternate alternate title: “Skip This if Statistics Bore You”)
You may recall a few days ago during one of my Blog Stats blogs I mentioned the problem of creating a cumulative distribution function-type plot for binary data, which would show the cumulative number of times one of the two binary variables occurred over some duration of another variable.
Um, let’s go to the actual example, ‘cause that description sucked.
Let’s say I have two variables called Blogs and Images for a set of data for which N = 2193. The variable Blogs gives the blog number for each post, so it runs from 1 to 2193. The variable Images is a binary variable and is coded 0 if the blog in question contains no image(s) and 1 if the blog contains 1 or more images.
Simple enough, right?
So what I was trying to do was create an easy-to-interpret visual that would show the increase in the cumulative number of blogs containing images over time, where time was measured by the Blogs variable.
Not being ultra well-versed in the world of visually representing binary data, this was the best I could come up with in the heat of the analysis:

If you take a look at the y-axis, it becomes clear that due to the coding, the Images variable could only either equal 0 or 1. When it equaled 1, this plot drew a vertical black line at the spot on the x-axis that matched the corresponding Blogs variable. It’s not the worst graph (and if you scan it at the grocery store, you’ll probably end up with a bag of Fritos or something), but it’s not the easiest-to-interpret graph on the planet either, now is it?
What I was really looking for was some sort of cumulative distribution function (CDF) plot, but for binary data. I like how Wiki puts it: “Intuitively, [the CDF] is the “area so far” function of the probability distribution.” As you move right on the x-axis, the CDF curve lines up with the probability (given on the y-axis) that the variable, at that point on the x-axis, is less than or equal to the value indicated by the curve. Assuming your y-axis is set for probability (mine isn’t, but it’s still easy to interpret). This is all well and good for well-behaving ratio data, but what happens if I want to do such a plot for a dichotomously-coded variable?
There were two ways to go about this:
1) Be a spazz and write some R code to get it done, or
2) Be an anti-spazz and look up if anybody’s written some R code to get it done.
I originally wanted to do A, which I did, but B was actually a lot harder than it should have been.
Let’s look at A first. I wanted to plot the number of surveys containing images against time, measured by the Blogs variable. Since I coded blogs containing images as 1 and blogs not containing images as 0, all I needed to get R to do was spit out a list of the cumulative sum of the Images variable at each instance of the Blogs variable (so a total of 2193 sums). Then plot it.
R and I have a…history when it comes to me attempting to write “for” loops. But it finally worked this time. I’ll just give you that little segment, ‘cause the rest of the code’s for the plotting parameters and too long/bothersome to throw on here.
for (m in (1:length(ximage))){
newimage=ximage[1:m]
xnew=sum(newimage)
t=cbind(m,xnew)
points(t,type="h",pch="1")
}
ximage is the name of the vector containing the coded Images variable. So what this little “for” loop does is create a new variable (newimage) for every vector length between 1 and 2193 instances of the Images variable. Another new variable (xnew) calculated the sum of 1s in each newimage. t combines the Blogs number (1 through 2193) with the matching xnew. Finally, the points of t are plotted (on a pre-created blank plot).
So. Wanna see?

Woo!
So I actually figured this out on Wednesday, but I didn’t blog about it because I wanted to see if I could find a function that already does what I wanted. Why did it take an extra three days to find it? Because I couldn’t for the life of me figure out what that type of plot was called. It’s not a true CDF because it’s not a continuous variable we’re dealing with. But after obsessively searching (this is the reason for the alternate title—I should have known what this type of plot was called), I finally found a (very, very simple) function that makes what this is: a cumulative frequency graph (I know, I know, duh, right?).
So here’s the miniscule little bit of code needed to do what I did:
cumfreq=cumsum(ximage)
plot(cumfreq, type="h")
The built-in function (it was even in the damn base package. SHAME, Claudia, SHAME!!) cumsum gives a vector of the sum at each instance of ximage; plotting that makes the exact same graph as my code (except I manually fancied up my axes in my code).

Cool, eh?
Maybe I’ll post my full code once I make it uncustomized to this particular problem.
Big Week o’ Blog Stats Celebration, Day 6: The Best of the Best of the Best, SIR!
It’s the last day of the big statistics marathon. Sad? I am. But I got a few new R projects coming, so you’ll be subject to those shortly.
Anyway. Today is less about stats analyses and more about just general naked-eye trends. What questions we’re looking at today:
A. What are my most popular blogs by view count on WordPress?
B. What are some of the most popular search terms people have used to arrive at my blog?
C. What are some of the most hilarious search terms people have used to arrive at my blog?
D. Blogs/topics I think are worth sharing that didn’t make my Best Of list up top.
Part A.
I’ve been on WordPress since September 1st, 2010. Since then, my most viewed blogs have been:
- (153 views) Scrabble Letter Values and the QWERTY Keyboard
- (149 views) Colored Beats!
- (58 views) Oh look, PayPal wants me to fill out a survey
- (34 views) TWSB: Well, it certainly would make the cartographer’s job easier…
- (28 views) TWSB: Weebles Wobble (But They Wouldn’t if They Had Three Legs)
- (26 views) Pi vs. e
- (19 views) An analysis of statewise uniform population density (according to Craigslist)
- (19 views) Claudia’s 365 Days of Music – A Review
- (18 views) 5 x 20 seconds of fun
Those may not seem like tremendously large viewing numbers, but considering I’ve got over 2,000 posts and like three people who actually frequent Eigenblogger, 153’s not too bad. Part B explains some of the numbers.
Speaking of which…
Part B.
Top 10 search phrases are:
- “colored beats”
- “Leibniz porn”
- “what one thing could paypal have done to improve your experience with the account limitation process”
- le seul mot juste”
- eigenblogger”
- “scrabble letter breakdown”
- “scrabble letter values”
- “scrabble letters”
- “scrabble letter rank”
- “rho rho rho your boat”
Yes, a freakishly large amount of times my blog has been found have been because of somebody (sombodies?) searching for “Leibniz porn.” That is simultaneously awesome and confusing. Does “porn” mean something like “metaphysical texts” in some other language? If not, and at least one person out there is searching for legitimate calculus-oriented, ostentatious wig-wearing, best-of-all-possible-smut Leibniz porn, WHO THE HELL ARE YOU AND WILL YOU BE MY SOUL MATE FOREVER?!
Ahem.
Le Seul Mot Juste was the name of my blog up until like three months ago.
And “rho rho rho?” Who the hell knows. Maybe my intellectually-compatible-perfect-future-boyfriend-husband-thing (hereafter referred to as my ICPFBHT) was trying to make some sort of stats pun as he sat hunched over his computer keyboard in a darkened room, chugging Red Bulls and listening to electronica. Naked. With stacks of Leibniz’ works next to him.
*Sigh…*
Anyway.
Part C.
People have found my blog by searching for rather humorous things such as:
- “jokes about leibniz cookies”
- “analysis without anal”
- “paddled in parachute pants”
- “yo dawg science”
- “jokes about godot”
- “if your a noodle and you know it clap your hands” (yeah, I have no idea, either.)
- “ who the hell is millard fillmore”
- “gdrydfjgki”
- “gavagai turnips”
Part D.
It’s shameless self-promotion time! I was going to make a big ol’ flowchart thing that showed you what blogs to go for depending on your general interests, but I’m lazy and I’m sure none of you readers really care that much, so you get this instead.
Got here via a statistics-related post and/or are interested in random recreational stats parties? Why not check out my blogs under the Statistics category?
Interested in philosophy?
What about science?
(Want to read me bitch about stuff?)
Haha, that’s all I got. So there you go! Six days’ worth of stats for six years’ worth of blogs. I hope to entertain you all for another six years at least.
Thank you for reading! Seriously. I’m not all about acquiring followers, but it is really nice to have regular readers. :)
Big Week o’ Blog Stats Celebration, Day 5: Overall Trends: Word Count and Gunning Fog Index
Today is mega trends day. I’ll be looking at blog-wide stuff like the overall changes in word count and the overall changes in the Gunning Fog Index. Woohoo!
Hypotheses:
A. The Word Count per blog has increased as time has gone on. That is, my blogs today are longer than my blogs when I first started.
B. The GFI per blog has increased as time has gone on.
C. There is no significant correlation between Word Count and the GFI.
Analyses!
I performed a regression (aka a glorified correlation in this case) between Word Count and Blog Number to determine if the number of words per blog has increased as time has gone on. Which indeed it has; predicting Word Count by Blog Number, the regression equation can be written as Word Count = 0.0613*Blog Number. Blog Number predicts a significant proportion of variance in the Word Count variable, F(1,2190) = 14.15, p < 0.001. Here is a plot. The red line is the regression line. As always, click on those bad boy plots to see them more clearly.

Same procedure for GFI vs. Word Count. The GFI, or Gunning Fog Index, remember, is a measurement of the readability of English writing and its values correspond to the number of years of formal education a person must achieve in order to fully understand the written passage. For example, a GFI of 10 suggests that an individual must have completed 10th grade in order to understand the material. To achieve near universal understanding, Wiki recommends that the GFI of a bit of text hover around an eight.
Anyway. The regression equation here is Word Count = 0.0008639(GFI). GFI predicts a significant proportion of variance in the Word Count variable, F(1, 2190) = 51.86, p < 0.0001. Here is another plot with another regression line.

Finally, I tested the correlation between Word Count and GFI. The correlation was -0.0028 but was not significant with t = -.0.1287, p = 0.8976.
Results:
A. Supported! The regression line isn’t very steep, but it’s significant still.
B. Supported! That’s actually a pretty impressive regression line, in my opinion.
C. Supported! There’s practically no correlation at all between the length of my blogs and the level of comprehension. I blame the surveys.
Woo!
Big Week o’ Blog Stats Celebration, Day 4: Common Words and Topics
Yay, I’ve been waiting for this day! Why? ‘Cause I get to use Wordle. I don’t have any hypotheses for today; rather, I have three main questions of interest.
Question A: how do my “commonly used words” change throughout the years?
Question B: are there some words I use more than others in my blog titles?
Question C: looking at my blog in total, what are my most commonly-used words?
Let’s go!
Question A: Using Wordle’s word counts, here’s a table of my top 10 words for each year (note: Worlde can automatically remove “common” words like the, and, a, etc., so I did that). Words consistently highly used across the years are colored.

(Year 1’s “Andy” is because of a short story I posted. Year 4’s “Hate” is because of grad school.)
Question B:
My top 10 words I use in my titles are:
- Blog
- Oh
- Survey
- Time
- Waiter (from all my “Waiter! There’s a…” titles)
- Claudia
- Day
- Just
- God
- One
Question C:
Here is a Wordle of my top 100 words spanning all six years!

I would have guessed I’d used the word “blog” a lot more. And my own name less. I use my name in my blog more than “haha” and I’m always dropping “haha”s all over the place! What.
Bonus: here are a few of my common phrases by year. A lot of these are biased because of one blog containing a repeating phrase, but they’re still amusing.
Year 1:
- “Claudia is”
- “Airplane airplane airplane airplane”
- “Who cares about apathy”
- “ag sci computer lab”
- “if you had sex”
Year 2:
- “the socio-adaptive force”
- “who said hello”
- “I can be absolutely fine”
- “go ahead and stir baby” (haha, it took me like twenty minutes to try and figure out why this was a popular phrase; then I remembered it was because of this)
- “the fact that I”
Year 3:
- “wifey wifey wifey wifey”
- “have you ever”
- “best of all possible” (hahaha, this was the year I discovered Leibniz)
- “the mad scientist’s life”
- “the last time you”
Year 4:
- “I hate this” (yup, grad school time)
- “your conversational partner has disconnected” (and Omegle time)
- “approach to environmental ethics”
- “what do you want”
- “today’s song”
Year 5:
- “this week’s science blog”
- “today’s song”
- “you have no idea”
- “for quite some time”
- “all of a sudden”
Year 6:
- “what do you think of”
- “I miss happiness”
- “what would it be”
- “the last time you”
- “sure why not”
Humorous.
Big Week o’ Blog Stats Celebration, Day 3: Titles, Surveys, and Images
It’s day three!
Today we’re looking at three different variables: trends in my Titles, the frequency of blogs involving Surveys, and the frequency of blogs involving Images.
To make sense of these variables and the stats surrounding them, I had to code them. As I said in my first blog stats-related post this week, for the Titles variable, titles were coded 0 if they had nothing to do with the blog content whatsoever (e.g., “Do obedient consonants respond to a Q queue cue?”), a 1 if they were directly relevant to the blog content (e.g., “Greek letters as broken down by meanings in Statistics: a subjective and torturous endeavor”), and 2 if they weren’t completely unrelated but one couldn’t guess the blog content from the title (e.g., “ZOMG”). For the Surveys variable, I just coded the blog entry as 0 if it didn’t contain a survey and 1 if it did. Same thing for the Images variable—a 0 if there were no images and a 1 if there were one or more images.
So. Do I have any hypotheses? Of course I do!
A: The majority of my blog titles have nothing to do with the blog content (that is, they’re coded as 0).
B: I’ve posted more Surveys as time has gone on.
C: I’ve posted more Images as time has gone on.
D: Blogs with Images have fewer words than blogs without Images.
Analyses:
Quick initial analysis: a pie chart of titles!

Hahaha, a quarter of my blog titles tell you absolutely nothing about the associated blogs. That’s fantastic.
Now some more serious fun. To determine whether the amount of Surveys I’ve been posting has been increasing with time, I first made a graph that looks like a bar code to get a rough idea of the frequency/spacing of surveys in my blog*. Each black vertical line represents a Survey blog (y-axis runs from 0 to 1 but since Survey is coded as either a 0 or 1, the appearance of a line indicates Survey = 1).

Second, I looked at the correlation between Blog Number (blog 1 was May 1, 2006, blog 2,192 was May 1, 2012) and the presence of a Survey. The way the coding works, a positive correlation would indicate that as time progressed, I had a greater tendency to post a survey-containing blog.
So….
In this case, I did get a positive correlation of rpb = 0.071. This isn’t the usual Pearson r correlation because I’m not comparing two continuous variables; rather, it’s a point biserial correlation to accommodate the dichotomously-coded Survey variable. However, it’s mathematically equivalent to the Pearson r, so I felt comfortable running a test of significance on the correlation. Turns out, the little .071 correlation is statistically significant, t = 3.346, p < 0.001. This means that the true correlation between Blog Number and the number of surveys I post is not zero and I’ve been posting more and more surveys as time has gone on.
Taking the same procedure with the Blog Number variable and the dichotomous Image variable, here’s another bar code-esque pic (black lines = blogs containing 1+ image):

Here we get an even stronger correlation of rpb = 0.194, which is statistically significant, t = 9.273, p < 0.0001. This shows that the true correlation between Blog Number and the number of Images my blog contains is not zero, and I’ve been posting more and more blogs containing an image as time has gone on.
Finally, I checked out word count between all blogs with Images and all blogs without Images. I made two subset data sets, one containing all the blogs with images, one containing all the blogs with no images, and ran a t-test. The difference in word count was (to me) surprisingly large and definitely significant, t = 6.658, p < 0.0001. The actual means of the No Image vs. Image blogs were 290.425 words and 177.925 words, respectively.
Now results:
Hypothesis A: Haha, totally not supported, and actually opposite: most of my Titles ARE directly relevant to the content. That’s…surprising to me. I name my blogs right before posting them (which is usually like a decade and a half after I write them, given how often I update this blog), and I’ve usually used the “mash the keyboard until the letters make sense” approach to titles. That, or “let’s see what dumb pun I can make today!”
Hypothesis B: Supported! This is probably strongly due to the fact that I’m working to complete the 5,000 Question Survey and have been working on it since late 2010.
Hypothesis C: Supported! WordPress makes it substantially easier to include images than MySpace ever did. Also, more time spent on the internet now = more random humorous images found via StumbleUpon/Tumblr/other blogs/etc.
Hypothesis D: Very supported. The actual word count difference between blogs with and blogs without Images was surprising to me, though the sample size difference could probably be considered a culprit. However, I guess it shouldn’t be too surprised, though; going through the archives I found quite a few blogs that were like “here’s an image!”, the image, and nothing else.
*Yeah, I know there’s got to be a more sophisticated way to represent this. Creating a CDF doesn’t work with a dichotomous variable. Maybe if I write a loop that adds all the preceding 1’s to each instance of a 1 it hits as it goes from Blog Number = 1 to Blog Number = 2193, and then create sort of a pseudo-CDF using that…hmm…next week’s project!!!
Big Week o’ Blog Stats Celebration, Day 2: Mean Word Comparisons by Weekday, Month and Year
Yo, blogland! Time for another round of “stats no one cares about except me!”
Today we’re looking at Word Count by Day of the Week, Month, and Year. I’d like to see if there are any general trends or if I blather on about nothing in relatively consistent bursts across time. Maybe if all these days of analyses reveal some trends, I could try fitting a model to this data. I loves me some model fittin’.
Onwards and upwards!
Hypotheses:
A. No one day of the week will have a statistically significant difference in word count than any other day of the week. I don’t think I blog more or less over the weekend, and I see no reason why any day of the five-day week would have longer blogs than any other.
B. I don’t know if they’ll be significant or not, but I’m predicting that word counts will in general be higher during the spring school months (January– April at least) than the summer/winter months. The more responsibilities I have, the more I turn to blogging for procrastination, and I usually take more credits in the summer.
C. From highest word count to lowest: Year 6, Year 2, Year 5, Year 4, Year 1, Year 3.
Ready? Analyses:
Here is a pie chart (a tasty, tasty pie chart!) of the percentage of words I’ve written by the day of the week.

Pretty equal, eh? But what does the ANOVA say? According to the stats, there are no statistically significant differences in word count by day of the week, F = 0.642, p = 0.697. According to the Tukey HSDs, none of the individual pairs of days of the week are statistically significant in terms of their word count, either.
Here is another pie chart. This one shows percentage of words by month.

Again, pretty even. Stats? F = 1.505, p = 0.123, meaning that there are no statistically significant differences in word count by month. No statistically significant differences in any of the pairs of months, either.
Finally, we jump to the largest span of time I’m looking at: years! Pie pie pie pie pie:

Haha, holy crap, Year 6 and Year 2 combined account for nearly half of the words in my total blog. Poor little Year 3.
And finally we see some significance! There is a statistically significant difference in word count by blog year , F = 11.021, p > 0.001.
Results:
Hypothesis A: Supported! All days of the week are subject to equal amounts of my blathering. Poor things.
Hypothesis B: Eh. Technically January, February, March, April, and May are the wordiest months, but they’re not significantly so.
Hypothesis C: Woo! I totally called it. If anyone’s curious, Year 3 was a word drought because I was living in the house with the guys and I had…other stuff occupying my time.
More to come tomorrow, ladies and gents!
Big Week o’ Blog Stats Celebration, Day 1: Mean Word Comparisons by Category
STATS TIME! Are you excited?
First, I want to preface all of this with the list of variables I kept track of when going through my blog archive:
- Blog Number. My first blog is coded as 1, the second as 2, the third is 3, and so on up until 2193.
- Year. Which blogging year the blog came from. There are six years, each spanning May – May.
- Month. January, February, etc.
- Day. The 1st of the month, 2nd of the month, etc.
- Weekday. Monday, Tuesday, etc.
- Word Count. Word count of each post, not counting the title.
- GFI. Gunning Fog Index.
- Punctuation. How many punctuation marks the post contained.
- Title. 0 = title unrelated to blog content, 1 = title directly relevant to blog content, and 2 = ambiguous title; could be related or unrlated.
- Survey. 0 = blog does not contain a survey, 1 = blog contains survey.
- Image. 0 = blog does not contain any images, 1 = blog contains 1+ image(s)
- Category. What category did I tag my blog as (details below).
ALSO NOTE: significance is always judged at the p = 0.05 level. Just didn’t want to have to keep specifying that. :)
So! Today we’re looking at Categories. There are 35 of them (or there will be once I go through and delete all the old “defunct” tags from the few blogs that still have them). Here’s the list in case anybody gives a crap:

So what are we looking at within this sexy, large dataset with respect to categories, then?
Questions of Interest
A) What is the distribution of the categories? That is, which categories are most popular and which are hardly ever used?
B) Do certain categories have a statistically significant different amount of words per post than the other categories?
Hypotheses
A: The most popular categories (by percent) will be Blogging, School, and probably Surveys.
B: The least popular categories will be Ramblings and Sports.
C: Categories with a significantly different number of words per post will be Surveys, Philosophy, and Rants.
D: The three categories specified in Hypothesis C will have higher word counts, not lower.
LET’S DO THIS NOISE.
Analyses
First up, a pie chart! This was my first attempt at visualizing category percentages. By the way, I definitely would have titled this like a good little statistician, but I couldn’t get the image large enough (in my opinion) with the title included. So I’ll call it Percent of Blogs by Category (NOT percent of words by category; that’s just in the ANOVA below).

I had to screw around with this a lot to get it in the easiest to read color scheme. Pie chart with 35 slices = not the best visual, but I think it’s still better than a bar graph in this case.
Table o’ actual counts (click to blow it up so it’s actually readable, haha):

God, all those Blogging blogs.

Second: ANOVAs! Well, okay, just one. But it’s an ANOVA!
According to a more in-depth, ANOVA-driven analysis…
- The mean Word Count per blog is statistically significantly different depending on blog Category, F = 23.184, p < 0.001.
- Blogs in the Surveys category have a significantly higher word count than the other categories, t = 7.739, p < 0.0001.
- Blogs in the Writing category have a significantly higher word count than the other categories, t = 3.624, p < 0.001.
- Blogs in the Philosophy category have a significantly higher word count than the other categories, t = 3.365, p < 0.001.
- Blogs in the Rants category have a significantly higher word count than the other categories, t = 2.480, p < 0.05.
I (or R, rather) also computed a buttload of Tukey HSDs (595 of them!) to test the mean differences between each pair of categories, but most of the significant ones involved (as expected) Surveys, Writing, Philosophy, and Rants.
So. Results:
Hypothesis A: supported! Blogging and school, man: my life.
Hypothesis B: mostly supported! There were a few categories that had nearly as few entries as Sports. I’d get rid of the Rambling category, but then I’d have 34 categories, which isn’t a nicely-dividable number like 35 (I like numbers ending in 0 or 5). Guess I just need to ramble more.
Hypothesis C: mostly supported! I’d totally forgotten about Writing.
Hypothesis D: supported! Surveys, Writing, Philosophy, and Rants contained blogs that had higher than average word counts.
Cool, huh?
Tune in tomorrow for more stats no one cares about except me!
I’ve been on WordPress for 6 months now
Ha, cool, I’ve been on WordPress for 6 months now. I must say, I’m much happier here than on MySpace, though the old, crappy social network will always hold a special place in my blogging heart (I know, I know, gag).
Views: 1,083
Posts: 1,423 (this doesn’t count the couple hundred that were private/friends only on my old blog and thus weren’t transferred; the total number of posts thus far not counting this one is 1,765).
Comments: 80
My top-viewed blogs:
Home page (658 views)
Scrabble Letter Values and the QWERTY Keyboard (36)
Who wrote all this drivel? (29)
Some pretty funny stuff (18)
Recur, recur, recur! (13)
There’s a tunnel! And there’s a light at the end of it! (13)
This Week’s Science Blog: The Robots are Getting Creepier (10)
Claudia’s 365 Days of Music – A Review (7)
A Blog for Jim LaFortune (7)
An analysis of statewise uniform population density (according to Craigslist)
The Scrabble one’s so popular because apparently people really like to search for Scrabble letter values on WordPress. Here are a few searches that brought people to that page:
scrabble letter breakdown
scrabble how many points is qwerty
all scrabble letters
scrabble letter ranking
letter ranking on scrabble
“frequency of use of letters” scrabble
And here are some more amusing searches that brought people here:
jokes about leibniz cookies (whoever searched for this is my soulmate)
le seul mot juste
geometric multicollinearity
mice smelling photons
Fun times! I’m bored.
Essentially, this is frivolity and I should be stopped
Alternate title: LOL BLOG 666 OMG WERE ALL GOING TO DIE!!!11!!ONE!!!
Now that the formalities are over I’d like to get right to the point: I’ve finally decided on what I’m going to analyze with a two-sample t-test in regards to my blogs.
I shall compare my “happy” blogs to my “sad” blogs (both terms to be defined further down) on various constituents (also to be defined further down).
Are you all ready for this?!?!
Goal:
Compare “sad” blogs and “happy” blogs on four independent points: number of words, number of smilies, number of exclamation points (indicative of excitement, frustration, flabbergastment, emphasis), and number of words in italics and/or in all caps (indicative of essentially the same things as exclamation points, but slightly cooler).
Definitions:
~”Happy” blog: a blog in which the mood is set to something indicative of a happy mood or an excited mood (amused, thrilled, silly, relieved, geeky/nerdy/dorky, and, of course, happy*).
~”Sad” blog: a blog in which the mood is set to something indicative of sadness, frustration, or anger (pissed, peeved, depressed, melancholy, sad, frustrated, angry*).
~Number of words: number of words in the body of the blog. The title/headings and the comments are not counted in this total.
~Number of smilies: just what it sounds like. Smilies like “:)” or “:P” used in chat dialogues are not counted.
~Number of exclamation points: as in this: !, not the number of times I say “exclamation points.”
~Number of words in italics and/or in all caps: this or THIS or THIS all count.
Method:
1) Generate an SRS of equal size n for both the happy blog data and the sad blog data
2) Collect data from said SRS
3) Analyze it in SAS
4) Bore you all to death with the results
Formulas in SAS:
proc univariate (for all variables)
proc ttest (for all variables, obviously the most important one if I’m doing t-tests!)
Procedure:
It was first figured that the population size was N = 665, as today’s blog was not counted amongst the viable samples. To determine an appropriate sample size for each category (happy and sad blogs), it was figured that a good n would amount to approximately 7% of the data. An n equal to 25 for both categories was used (thus having a total n = 50).
The blogs were numbered in a rather ingenious manner (thank you very much), and the SRS was obtained through sampling done with a random number table. If a blog obtained was deemed neither happy nor sad (indifferent blogs) it was disregarded and another random number was chosen in its place and sampling continued as normal.
Data was collected for both categories in all variables (see Raw Data) and was then analyzed using SAS. Results are displayed below in the Results section.
Raw data:
Data names: blogno; words; smilies; exclamations; italiccaps; happysad;
89 300 1 9 19 h
156 124 0 0 0 h
574 42 0 1 0 h
166 108 1 1 0 h
389 51 1 2 0 h
422 83 1 0 0 h
556 34 0 0 0 h
446 126 1 2 0 h
653 900 1 9 38 h
275 370 0 6 0 h
371 161 1 0 0 h
465 215 0 1 0 h
637 457 0 10 21 h
3 223 3 4 1 h
351 296 0 12 1 h
167 252 0 2 1 h
52 180 0 1 0 h
649 862 0 34 10 h
631 399 1 8 42 h
64 22 1 2 0 h
55 57 1 0 0 h
237 453 0 32 16 h
236 49 1 3 2 h
298 186 1 2 2 h
20 115 2 1 0 h
643 174 0 3 0 s
186 23 1 0 1 s
316 166 0 0 1 s
90 74 0 0 0 s
161 105 3 3 14 s
115 76 2 2 3 s
439 131 0 1 0 s
522 370 0 3 8 s
202 70 1 1 3 s
8 360 1 15 1 s
381 1258 0 18 38 s
468 128 0 0 2 s
12 59 0 0 0 s
41 21 0 0 0 s
474 174 1 0 0 s
425 459 0 0 0 s
265 236 0 2 1 s
311 64 1 0 0 s
363 5734 0 3 2 s
518 310 0 0 1 s
579 181 1 0 0 s
497 81 0 0 0 s
416 414 0 1 0 s
385 59 0 0 0 s
Results:
OH ARE YOU READY FOR THIS?! This is intense, people.
First up: the results of the univariate procedures for each variable. These data are for the whole sample, remember.
Words
Mean: 336.36 (standard deviation = 815.33)
Minimum: 21
Maximum: 5734
Smilies
Mean: 0.56 (standard deviation = 0.76)
Minimum: 0
Maximum: 3
Exclamation Points
Mean: 3.88 (standard deviation = 7.26)
Minimum: 0
Maximum: 34 (thirty-four exclamation points in a single blog? Good lord)
Italicized and/or All Caps Words
Mean: 4.56 (standard deviation =10.17)
Minimum: 0
Maximum: 42
Second: t-test results!
Words
Mean number of words in happy blogs: 242.6
Mean number of words in sad blogs: 430.12
Using –=.05, the results of the two-sample t-test showed that there was not a significant difference in the mean number of words in the two types of blogs. Though it sure looks like it from comparing the two, doesn’t it? That’s stats for ya.
Smilies
Mean number of smilies in a happy blog: 0.68
Mean number of smilies in a sad blog: 0.44
Sorry guys, this one isn’t showing a significant difference in the means, either. I guess I’m pretty constant with my particulars in my blogs, regardless of how I’m feeling.
Exclamation Points
Mean number of exclamation points in a happy blog: 5.68
Mean number of exclamation points in a sad blog: 2.08
Ooh, we were pretty close on this one! When I saw this result I was tempted to raise my alpha level to .1, thus making this one statistically significant, but then I figured that would be data manipulation, so I didn’t do it. Praise me!
Italicized and/or All Caps words
Mean number of italicized and/or words in all caps in a happy blog: 6.12
Mean number of italicized and/or words in all caps in a sad blog: 3
You guessed it—the means are not statistically significantly different. Strange, huh?
Now you may be thinking I did all this for nothing. Quite the contrary! We’ve learned from a sample of 50 blogs that, according to the data, my happy and sad blogs do not differ in a statistically significant manner on four key points. I find that interesting, myself.
As for you, well…you’re probably nodding off right now, so I’ll stop here.
*Does not encompass all moods used for defining the categories. I could have gone through and listed them all, but I’m too lazy for that.
Waiter! There’s a Super Nova in my ANOVA! How in the World…?
Ladies and gentlemen, I present to you the first actual statistical analysis of my blogs. It’s a crappy one (just a SRS + proportion estimate) because I couldn’t think of anything else that was interesting and thus couldn’t think of anything worthy of a two-sample t-test. So disappointing!
But anyway.
Goal of analysis: to discover what proportion of my blogs are surveys.
Method:
1) estimate several bounds
2) using the best estimated bound, calculate an acceptable sample size (n) from which to gather data.
3) use data gathered in step 2 to calculate the total population proportion of blogs that are surveys with a reasonable bound on the error of estimation.
Formulae used:
To estimate appropriate sample size:
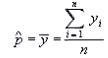
To estimate population proportion:
To estimate variance and bound on the error of estimation, respectively:

Procedure:
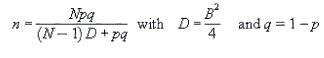
The initial N was 663, as that was the total number of blogs. It was found best to set p = .5, as that would give us the most conservative estimate and a sample size larger than would be necessary. Several magnitudes of B were plugged into the sample size equation, and the best was found to be B = .17. This was used in the sample size equation and an n of 33 was obtained.
Using a random numbers table, a SRS of 33 blogs was obtained. Each specific blog was looked up and marked as to whether or not it contained a survey. Results from this SRS are below (a ‘0’ indicates no survey, a ‘1’ indicates a survey):
Blog Survey?
139 0
163 0
198 0
41 0
145 0
66 0
301 0
253 0
380 1
2 0
408 1
400 0
440 1
259 1
351 0
273 0
487 0
183 0
599 1
510 0
473 0
170 0
534 0
257 0
279 0
151 0
394 0
186 0
604 1
577 0
388 0
568 1
221 0
These results were used in the calculation of the total population proportion of the proportion of blogs that were surveys. The result of this equation was .21. The variance of the data in the SRS was then calculated (=.007405213) and then used to calculate the bound on the error of estimation, which came out to be .17.
Therefore, we can extrapolate that 21% +/- 17% of my blogs are surveys. Or, anywhere from 4% to 38% of my blogs are surveys.
Yes, yes, I know that’s a horrible, horrible bound on the error of estimation (seriously, 17% either way?! Blasphemy!) but I don’t think you realize how hard it is to actually go back and figure out the specific number of each blog I’ve ever written. There are 663 of them, you know.
So yeah. That’s all I’ve done tonight, basically. Do you people have any ideas for possible blog-related things I could statistically analyze? I’m dyin’ here.

