NoSleep4U
You know you’re bad at sleeping like a normal human being when, after the first two questions in a sleep survey, you get this:

Yeah.
Master Recipe List
HELLO, FOOL MACHINES!
So I’ve been really into posting links to recipes over the past year or so, right? Well, last night I decided to just make a giant Word document containing the ingredients/instructions for my favorite of said posted recipes, just in case they ever get taken down.
I shall share this document with you here!
The original sources for the recipes are linked, and the pictures belong to the corresponding sources. Recipes that do not have sources (or pictures) are recipes I learned from my mom.
WOO!
Week 16: The Kolmogorov-Smirnov Test for Two Independent Samples
[This is coming out on a Monday ’cause I was super busy yesterday and had no time to make this/post it.]
Today’s test is a non-parametric test for two samples: the Kolmogorov-Smirnov test for two independent samples!
When Would You Use It?
The Kolmogorov-Smirnov test for two independent samples is a nonparametric test used to determine if two independent samples represent two different populations.
What Type of Data?
The Kolmogorov-Smirnov test for two independent samples requires ordinal data.
Test Assumptions
- All of the observations in the samples are randomly selected and independent of one another.
- The scale of the measurement is ordinal.
Test Process
Step 1: Formulate the null and alternative hypotheses. The null hypothesis claims that the the distribution underlying the population for one sample is the same as the distribution underlying the population for the other sample. The alternative claims that the distributions are not the same.
Step 2: Compute the test statistic. The test statistic, in the case of this test, is defined by the point that represents the greatest vertical distance at any point between the cumulative probability distribution constructed from the first sample and the cumulative probability distribution constructed from the second sample. I will refer you to the example shown below to show how these calculations are done in a specific testing situation.
Step 3: Obtain the critical value. Unlike most of the tests we’ve done so far, you don’t get a precise p-value when computing the results here. Rather, you calculate your test statistic and then compare it to a specific value. This is done using a table. Find the number at the intersection of your sample sizes for your specified alpha-level. Compare this value with your test statistic.
Step 4: Determine the conclusion. If your test statistic is equal to or larger than the table value, reject the null hypothesis (that is, claim that the distribution of the data is inconsistent with the hypothesized population distribution). If your test statistic is less than the table value, fail to reject the null.
Example
For this test’s example, I want to use some of my music data from 2012. I know that I tend to listen to music from the “electronic” genre and from the “dance” genre fairly equally, so I want to determine, based on play count, if I can say that the population distributions for these genres are similar. To keep things simple, I will use nelectronic = 6 and ndance = 6.
H0: Felectronic(X) = Fdance(X) for all values of X
Ha: Felectronic(X) ≠ Fdance(X) for at least one value of X
Computations:
For the computations section of this test, I will display a table of values for the data and describe what the values are and how the test statistic is obtained.

Column A and Column C, together, show the ranked values of the play counts for electronic (Column A) and dance (Column C).
Column B represents the cumulative proportion in the sample for each play count in Column A. For example, for the play count = 7, the cumulative proportion of that value is just 1/6, since there is no smaller value in Column A.
Column D represents the same thing as column B, except for Column C.
Column E is Column B – Column D.
The test statistic is obtained by determining the largest value from Column E. Here, the test statistic is .5. This value is compared to the critical value at α = 0.05, n1 = 6, n2 = 6, which is .667. Since our test statistic is not larger than our critical value, we fail to reject the null and claim that the distributions of play counts for electronic and dance are similar.
Example in R
No R example this week, as this is pretty easy to do by hand, especially with having to rank things.
Witty title? Nope.
I AM DEAD from that freaking test, man.
Have some of my favorite bookmarks, ‘cause I’m pretty much worthless for anything else today.
- 5 Second Films. Because they’re the best.
- This site gives you letters one by one and you have to make words out of them in a timed environment.
- Dogwood Ceramics. Want clay and glaze and related art tools? This is the place!
- Want to look at recipes? Foodgawker!
- I’ve linked to this before, but if you want to read fiction with a mathematical theme, go here!
- Powder Game. I remember Aaron playing this for HOURS when we first discovered it.
- A list of good redwood hikes, in case you ever get to northern California and want to see some amazing trees.
- Wind map for the US.
I’m a cayenne pepper. WHAT THE HELL ARE YOU????/???
UGH, that test was brutal. Like, the problems were all very similar to the homework questions, but they were all similar to the six most difficult homework questions. The ones that required weird-ass tricks that were somewhat unrelated to the material we needed to know for the class.
But whatever, you know? Either I make it through this class or I have to stay an extra year and torment those who don’t want me around.
Those who shall not be named.
Yeah.
IT’S THAT TIME OF YEAR AGAIN
THE TIME FOR DISGUSTING FEET!
I have no freaking idea how my feet get so dirty. I mean, I get that I’m out walking for like 3+ hours, but it’s not like I’m walking on dusty paths. I’m on the sidewalks. Is Calgary really that dusty?
Oh well.
I won’t spam you with my nasty feets this summer, I promise.
Fake It ‘Till You…Fake It, I Guess
Do you know what time of the year it is?
It’s FAKE UI CLASS SCHEDULE TIME!!!
Let’s do it.
MWF
HIST 411: Colonial North America (10:30 – 11:20)
MATH 310: Ordinary Differential Equations (11:30 – 12:20)
BIOL 120: Human Anatomy (12:30 – 1:20)
MATH 579: Combinatorics (1:30 – 2:20)
TH
CS 360: Database Systems (12:30 – 1:45)
GEOG 301: Meteorology (2:00 – 3:15)
MUSA 121: Concert Band (4:30 – 5:20)
T
BIOL 120: Human Anatomy Lab (8:30 – 11:20)
W
ENGL 582: Techniques of Fiction (5:00 – 7:50)
Yay!
Interesting…
So here’s something interesting.
I was looking at my old 23andMe results that I got back in like 2012, ‘cause I wanted to show them to Nate. Back when I had first gotten the results back, I was more interested in the medical results (things I have more of a risk of getting, things I am low risk for, etc.). But today, I decided to look in more detail at the Ancestry Composition information. Here’s what I’ve got for my composition:

First off, I thought I was basically 100% European. Which is apparently not the case. I have no idea where that relatively large (in my opinion—remember I thought I was like 100% European) Native American percentage is coming from. Or that tiny bit of West African. Like…have you seen my family?
Also, something I didn’t know: Ashkenazi is a Jewish ethnic division, mainly from Germany, so that’s cool.
So I am mainly European, but not as European as I thought I was.
Week 15: The Mann-Whitney U Test
Today we’re going to talk about another nonparametric test: the Mann-Whitney U test!
When Would You Use It?
The Mann-Whitney U test is a nonparametric test used to determine if two independent samples represent two populations with different medians.
What Type of Data?
The Mann-Whitney U test requires ordinal data.
Test Assumptions
- Each sample is a simple random sample from the population it represents.
- The two samples are independent.
- The original scores obtained are continuous random variables (which are later ranked).
- The underlying distributions of the samples are identical in shape (but do not necessarily have to be normal).
Test Process
Step 1: Formulate the null and alternative hypotheses. The null hypothesis claims that the two population medians are equal. The alternative hypothesis claims otherwise (one median is greater than the other, or that they are simply not equal).
Step 2: Compute the test statistics: U1 and U2. Since this is best done with data, please see the example shown below to see how this is done.
Step 3: Obtain the critical value. Unlike most of the tests we’ve done so far, you don’t get a precise p-value when computing the results here. Rather, you calculate your U values and then compare them to a specific value. This is done using a table (such as the one here). Find the number at the intersection of your sample sizes for both samples at the specified alpha-level. Compare this value with the smaller of your U1 and U2 values.
Step 4: Determine the conclusion. If your test statistic is equal to or less than the table value, reject the null hypothesis. If your test statistic is greater than the table value, fail to reject the null (that is, claim that the medians are equal in the population).
Example
Today’s data come from my 2012 music selection. I wanted to see if the median play counts for two genres—pop and electronic—were the same. I chose these two because I think most of my favorite songs are of one of the two genres. To keep things relatively simple for the example, I sampled n = 8 electronic songs and n = 8 pop songs. Set α = 0.05.
H0: θpop = θelectronic
Ha: θpop ≠ θelectronic
The following table shows several different columns of information. I will explain the columns below.

Column 1 is the genre of each song.
Column 2 is the play count for each song.
Column 3 is the overall rank of the play count, regardless of which genre it came from.
If there had been ties, I would have summed the number of ranks that were taken by the ties, and then divide that value by the number of ties.
To compute U1 and U2, use the following equations:

So here,

The test statistic itself is the smaller of the above values; in this case, we get U = 28. In the table, the critical value for n1 = 8 and n2 = 8 and α = 0.05 for a two-tailed test is 13. Since U > 13, we fail to reject the null and retain the claim that the population medians are equal.
Example in R
No R example this week; most of this is easy enough to do by hand for a small-ish sample.
Kefin
Over the past three weeks, I’ve had a week where I’ve walked more than average, a week where I’ve walked less than average, and a week where I’ve walked an average amount. I decided to make a little graph of the differences.
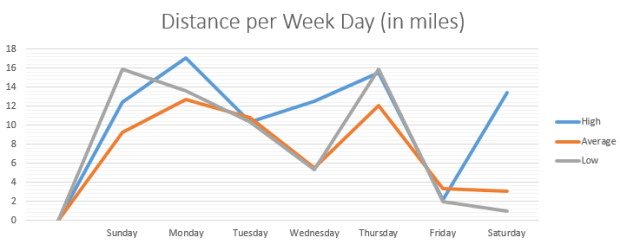
Here are the totals for each week:
“Low”: 56.62 miles
“Average”: 63.93 miles
“High”: 83.46 miles
Sorry, I don’t have anything else to blog about today.
Hee
Haha, this is a well-done music video.
And have another totally unrelated one, because for some reason I was thinking about this music video a while ago and just decided to look it up again.
Emojis are dumb and so is your face
Am I the only one?
Am I the only one?
I mean, emoticons were one thing. They were born in the soulless era of early internet and thus are blameless, holy creatures that are not to be shunned simply because humans, as a species, didn’t quite know how to “internet” back then.
But these buggers?


Everything is awful.
Like, I get the point of some of the smileys if they’re use to denote tone or something like that. But what’s the point of some of the other ones? WHAT’S THE POINT OF THE POOP ONE?
Emojis almost as bad as excessive hashtags.
Almost as bad as excessive hashtags.
Edit: what in the everlasting hell. What are they going to do, have the little faces bounce around for an hour and a half with the same freaking expressions? I get that every time I check my damn Facebook. Why do these godawful things need a movie?
Society, I am disappoint.
Okay, I need to rant (again)
What do I need to rant about, you ask?
These things.

(Source)
These goddamn things.
Not the buttons/signs themselves, but the fact that like 98% of people are too stupid to understand how they work. Do you see the arrow on that sign? If you want to cross in that direction, you press the button. If not, don’t press the damn button.
These signs are even easier to understand up here. They specifically say “Push button to cross [insert street here].” But do people understand that?
NO.
THEY MASH THE DAMN BUTTON NO MATTER WHAT.
This wouldn’t bother me nearly as much if it didn’t screw things up with my timing at crosswalks.
Scenario: There’s an intersection* of a fairly busy road (let’s call it A St.) and a slightly busy road (let’s call it B St.). The sign to cross B St. is always set to “walk” unless someone pushes the button to cross A St.
I’m walking down the sidewalk along A St., heading toward the intersection. I want to continue along the sidewalk where I am, so I just want to use that “always set to walk” sign. However, some dude comes up and presses the button to cross A St.
No big deal. He wanted to cross A St., so it’s legit.
But now, as he’s crossing, another dude walks up and wants to cross B St., like I do. But instead of being patient and just waiting for the A St. one to stop flashing, he PUSHES THE DAMN BUTTON TO CROSS A ST.
And what happens? He gets across B St. fine, but his pushing the A St. button screws up the timing and the B St. sign goes red again by the time I get there (because someone pressed the button!), forcing me to stop.
Like…is this rocket science? Read the damn signs, people. They’re right there. It’s not hard.
This makes me so irrationally angry.
*Actually, there are a lot of intersections like this in Calgary.
A Survey! Yay?
1 – If you were stranded on an island, who do you wish to be with?
I’d say Nate, but that would imply forcing him to be stranded on an island as well. So…Donald Trump? At least he’d be away from the US, and I could probably push him off a cliff.
2 – What do you feel right now?
I feel cold. But that’s standard.
3 – What chocolate is your favorite?
Don’t mess with my peanut M&Ms, man. Just don’t.
4 – Why did you create a blog account?
Peer pressure, haha. Do you see what you’ve done, Aneel and E’raina? DO YOU SEE WHAT YOU’VE DONE??
5 – Who is your favorite blogger?
Dave over at Blogography is awesome. I’ve been reading his blog for a long time, but I’m too shy to actually contact him and tell him he’s awesome. ‘Cause I’m a winner.
6 – When was the last time you cried? Why?
Pretty recently, and I have no idea why.
7 – Who is your best friend?
Nate!
8 – What kind of music do you listen to?
I’ll listen to almost anything, but I prefer songs with a really strong, upbeat tempo.
9 – Do you have troubles sleeping at night?
HAHAHA. No.
10 – What do you prefer, jeans or shorts?
Ew, neither.
11 – Did you try to change for a person?
I used to. Now I don’t care. Either like me as I am, or don’t bother with me.
12 – Are you in a good or bad mood?
I’ve been in a constant bad mood since February 1st.
14 – Do you have a grudge against anyone?
I don’t know if you’d call it a grudge…I’m extremely angry at them, let’s just say that.
15 – Are you a crybaby?
Yup.
16 – When people praise you for your looks, what feature do they praise?
They don’t.
17 – What hair color do you prefer?
Either really dark or blonde, haha.
18 – If you can change anything about yourself, what is it?
A lot of things. Too many things to list here.
19 – Can you live without internet?
Yes, but it would be hard, at least at first.
21 – Did you have an accident last year?
No.
22 – What are you thinking right now?
“It’s 5 AM, I should sleep. BUT SCREW THAT!”
23 – Have you been hurt so bad that you can’t find words to explain how you feel?
I used to think so, but it really wasn’t that bad.
24 – Do you have trust issues?
Indeed.
25 – Who’s the person who first comes to your mind when someone mentions “love”?
Nate!
26 – Do you believe in the phrase “If it’s meant to be, it will be”?
It is the best of all possible worlds, after all.
27 – Do you believe in destiny?
See above.
28 – How do you look right now?
Horrible.
29 – Did you ever feel like you’re not good enough?
Always. Haha, this is a depressing survey.
30 – Favorite city?
I love Calgary, but I also love Vancouver. In a different way, though.
Powerpuff Yourself
Why not. I’m bored and terrified of my upcoming final in Dr. Lu’s class. What better way to prepare for that than to make a Powerpuff version of myself?

Soon!
ZOMG guys, my one decade anniversary of blogging is one month away!
(Cue panicking)
So here’s the plan: for the week following my decade post (which will be on a Sunday), I’m going to do some blog stats/analyses. I kind of did this back when I hit six years, but I want to be a little more comprehensive this time. I’ll have a huge spreadsheet of all my 10 years of data (including word count, category, title, number of pictures per post, etc.), so there will be a lot of stuff I can analyze.
And we all know I love doing that kind of stuff.
YAY, I’m excited.
HOEDOWN, BITCHES
ALRIGHT, SO.
Tonight I was listening to some Aaron Copland, ‘cause Copland’s awesome. Specifically, I was listening to Hoedown on repeat for about a half an hour. Some of you may know it better as “the beef song”:
Anyway, awhile back, Nate and I had either seen the name of this song somewhere or had heard a reference to it, and when I referred to it as “the beef song,” he didn’t know what I was talking about (‘cause apparently it’s only ‘Murican beef that’s for dinner). So tonight when I had finished listening to it for like the tenth time, I let him have a listen and told him again that this was the beef song. He mentioned that he thought he’d heard this somewhere before. After a quick YouTube search, it turns out that a very similar song was in Fieval Goes West!
This song was actually composed by James Horner (RIP); apparently he took Copland’s Hoedown and kind of remixed/remade it to fit the movie.
Pretty awesome if you ask me.
[ [ [ [rage] ] ] ]
Do you ever have those days where you just want to sucker punch the universe?
That’s me today. I am angry. Almost irrationally so. Anytime I allow myself to think about what’s happened this semester, I just get so angry.
Probably too angry, since there’s not really anything I can do about it.
But UGH. It’s a draining feeling. I’m tired of feeling angry, but I have a hard time not feeling angry, you know?
BLAH.
ZOMG IPHONE
DUDE, the new iPhone is the best ever and I want it.
Elaboration:
I’ve wanted an iPhone for quite some time now, as you all know. However, I haven’t really enjoyed the trend of them getting larger with each new model. Like, by the time we get to the iPhone 10, it’s going to be the size of a surfboard at this rate.
BUT.
The iPhone SE is awesome. Why?
1. It’s tiny. Well, not tiny, but smaller than the iPhone 6 monstrosities.

2. It’s shaped like the iPhone 4. I LOVE THE SHAPE OF THE IPHONE 4.

3. It’s way more up to date software-wise than my iPod. Which is a pretty easy thing to be, considering my iPod is from 2012 and the software stopped updating like a year and a half ago. Yeah.
I want it. But the company I’m planning on using once I finally upgrade to a smartphone doesn’t have iPhones as options. And the phone itself, without a plan, is $700.
So that’s not happening, unfortunately.
ZZZ
Had a midterm today.
Feel dead.
Sorry for crappy post.
Week 13: F Test for Two Population Variances
Today we’re going to talk about variances. Specifically, the F test for two population variances!
When Would You Use It?
The F test for two population variances is a parametric test used to determine if two independent samples represent two populations with homogeneous (similar) variances.
What Type of Data?
The F test for two population variances requires interval or ratio data.
Test Assumptions
None listed.
Test Process
Step 1: Formulate the null and alternative hypotheses. The null hypothesis claims that the two population variances are equal. The alternative hypothesis claims otherwise (one population variance is greater than the other, less than the other, or that the variances are simply not equal).
Step 2: Compute the test statistic, an F value. The test statistic is computed as follows:
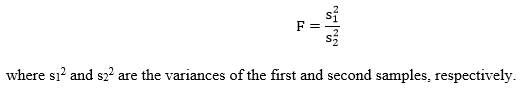
Step 3: Obtain the p-value associated with the calculated F value. The p-value indicates the probability of a difference in the two sample variances that is equal to or more extreme than the observed difference between the sample variances, under the assumption that the null hypothesis is true. The two degrees of freedom associated with the F value are df1 = n1-1 and df2 = n2-1, where n1 and n2 are the respective sample sizes of the first and second sample.
Step 4: Determine the conclusion. If the p-value is larger than the prespecified α-level, fail to reject the null hypothesis (that is, retain the claim that the population means are equal). If the p-value is smaller than the prespecified α-level, reject the null hypothesis in favor of the alternative.
Example
The data for this example come from my walking data from 2013 and 2015. I want to see if there is a significant difference in the mileage variance for these two years (in other words, was I less consistent with the length of my walks in one year versus the other? Set α = 0.05.
H0: σ12 = σ22 (or σ12 – σ22 = 0)
Ha: σ12 ≠ σ22 (or σ12 – σ22 ≠ 0)
Computations:

Since our p-value is smaller than our alpha-level, we reject H0 and claim that the population variances are significantly different (with evidence in favor of the variance being higher for 2015).
Example in R
year2013=read.table('clipboard', header=F) #data from 2013
year2015=read.table('clipboard', header=F) #data from 2015
s1=var(year2013)
s2=var(year2015)
df1=length(year2013)-1
df2=length(year2015)-1
F=s2/s1                        #test statistic
pval = (1-pf(F, df2, df1))     #p-value

