Week 31: The Cochran Q Test
Let’s do some more nonparametric testing today with the Cochran Q test!
When Would You Use It?
The Cochran Q test is a nonparametric test used to determine if, in a set of k dependent samples (k ≥ 2), at least two of the samples represent different populations.
What Type of Data?
The Cochran Q test requires categorical or nominal data.
Test Assumptions
- The presentation of the k experimental conditions is random or counterbalanced.
- With matched samples, within each set of matched subjects, each of the subjects should be randomly assigned to one of the k experimental conditions.
Test Process
Step 1: Formulate the null and alternative hypotheses. For the Cochran Q test, we are interested in variables that are dichotomous (let’s say that they have a “yes” and a “no” response). The null hypothesis claims that the proportions of one of the responses is the same across all j experimental conditions. The alternative hypothesis claims otherwise (at least two population proportions are not equal).
Step 2: Compute the test statistic, Q, which is a chi-square value. It is computed as follows:

Step 3: Obtain the p-value associated with the calculated chi-square. The p-value indicates the probability of observing a Q value equal to or larger than the one calculated for the test, under the assumption that the null hypothesis is true.
Step 4: Determine the conclusion. If the p-value is larger than the prespecified α-level, fail to reject the null hypothesis (that is, retain the claim that the proportion of “yes” responses is equal across the k experimental conditions). If the p-value is smaller than the prespecified α-level, reject the null hypothesis in favor of the alternative.
Example
The example for this test comes from a previous semester’s STAT 213 grades. Students took two midterms and a final. I wanted to determine if there was a difference in the proportion of students who passed midterm 1, midterm 2, or the final, in a sample of n = 30. Let α = 0.05.
H0: πmid1 = πmid2 = πfinal
Ha: At least two of the underlying population proportions are not equal.
The following table shows the data for this example. Here, a passing grade is coded as “1” and a failing grade is coded as “0”.

Computations
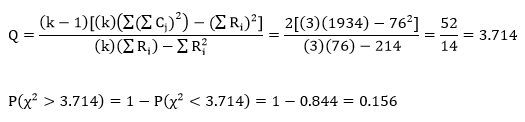
Since our p-value is larger than our alpha-level, we fail to reject H0 and claim that the proportions for each of the three tests are equal.
Example in R
Since the calculations for this week’s test are quite easy, it’s probably faster to do them by hand than use R!
Ch-Ch-Ch-Chernoff
Want to read about one of the weirdest types of data visualization? Then you want to read about Chernoff faces!
Chernoff faces are as weird as they sound. The idea is to represent different variables as features on a human face. For example, a person’s income could be represented by a Chernoff mouth, with a smile indicating higher incomes and a frown indicating lower incomes. Simultaneously, a person’s health could be represented by Chernoff eyes, with brighter and wider eyes corresponding to good health and tired, listless eyes corresponding to poor health. The more variables there are, the more facial components can be manipulated.
And if you think that sounds like it gets weird, it does:

(source)
The original motivation for Chernoff faces was that humans are basically primed to respond to and interpret faces and face-shaped things. Since we’re so good at interpreting faces, let’s turn data into faces so that we become good at interpreting the data, right?
Well, not really.
One of the main criticisms of Chernoff faces that is mentioned in the above article is that humans respond to faces “as a whole” rather than piece-by-piece. For example, when we look at two faces that differ only in the position of the eyebrows (maybe one has lowered eyebrows and the other has raised eyebrows), we don’t really think of the difference in that way. We think of the faces overall as having different expressions and thus different interpretations. We don’t focus on the eyebrows alone—we focus on the “whole package.”
While this is all well and good for actual faces, it actually makes interpreting changes in variables difficult to understand if those changes are represented by one or two changes on a Chernoff face.
Anyway. It’s actually a really interesting article discussing a really interesting and unique data presentation method. Give it a read!
TtT
This is all I’ve got for today, but really…isn’t this enough?
So You’ve Decided to Hate Pokemon Go
That’s fine! You’re completely allowed to have opinions about a game. But as soon as you start hating the players of said game? You probably need to chill.
Context: I have a surprising number of conservative, older friends on Facebook. They’re mostly teachers from high school and whatnot. A few of them post a lot of racist, bigoted garbage that I try to just ignore (at least, I did before just hiding their posts, haha).
Anyway, tonight after sending approximately 8,000 Pidgeys to the professor, I got the wonderful idea to see what these incredibly enlightened friends of mine thought of Pokemon Go. Was it the work of the devil? The work of Obama? The work of Muslims? THE WORK OF DEVIL MUSLIM OBAMA?!?!?!?! I checked out their pages, and yeah, pretty much:


LOL @ “mancard.” Seriously?
Let me ‘splain a thing. There’s a path alongside the Bow River here called the RiverWalk. It’s a path dedicated to cyclists/walkers/rollerbladers/skateborders/etc. so they can hang out by the river without fear of getting mowed over by crazy drivers. Usually there’s a decent amount of people out there, but I’ve never seen as many people out there as there were today.
Why where there so many people out there? Two words: Pokemon Go.
Seriously. There were SO MANY people out wandering around. People were out on their own, people were out with their significant others, people were out with groups of friends.
Does it matter that most of them had their heads down, looking at their phones, for most of the time?
Does it matter that they were busy hunting Pidgeys and Zubats and whatnot rather than, say, having a picnic or reading a book in the shade?
Does it matter that it took a game on a phone to bring these people outside?
No.
What matters is that people were outside having fun. People were walking around on paths they may not have ever used in order to find Pokemon or use Pokestops. People were sitting in the shade, camping Pokestops, talking with their friends about which teams they were on and what their strongest Pokemon were. People were having fun. People were enjoying the outdoors. It shouldn’t matter why.
That’s what pisses me off about people saying “ZOMG POKEMON GO IS THE DEVIL THOSE STUPID MILLENNIALS ARE GLUED TO THEIR PHONES WHY IS THIS EVEN POPULAR I HATE POKEMON GO AND AM THUS VASTLY SUPERIOR IN EVERY WAY”
Okay. Point one? People were glued to their phones before Pokemon Go. You know they were. You can’t deny it.
Point two? Niantic created something that relies heavily on nostalgia for a huge demographic. Surprise! It’s popular! And why on earth is that a bad thing? I reiterate: people are having fun with it. Let. People. Have. Their. Fun.
Point three: how pathetic do you have to be to complain about the popularity of something you dislike? If you hate it, don’t waste your energy berating it to the point that you’re insulting the people whose opinions don’t match yours. So you hate Pokemon Go. Cool, good for you. Don’t play it. But stop being a whiny bag of week-old piss and let the people who enjoy it just enjoy it.
It’s not hard.
You just need to chill.
Yikes
Dudes. This is simultaneously the coolest and creepiest thing I’ve seen in a while. Basically, Graham is a person constructed to survive a car accident, either as a passenger or as a pedestrian. His head/brain/skull, neck, chest, skin, knees, and feet have all been adjusted to be optimally protected in an accident. It’s really interesting to read the reasons behind the changes.
Who’s teaching STAT 213 next semester?
I AM, THAT’S WHO!
This afternoon, in the span of about an hour, I went from hoping to eventually get a teaching job somewhere to hearing that I get to teach a section of STAT 213 in the fall. It’s currently just for that semester, meaning there’s no guarantee that I’ll be hired for any subsequent semesters, but that’s what they said at UI and I worked for two years (plus summers) as a lecturer there before heading to the frigid north.
WICKED.
I am super, super excited, yo.
Week 30: The Friedman Two-Way Analysis of Variance by Ranks
Let’s return to nonparametrics this week with the Friedman two-way analysis of variance by ranks!
When Would You Use It?
The Friedman two-way analysis of variance by ranks is a nonparametric test used to determine if, in a set of k (k ≥ 2) independent samples, at least two of the samples represent populations with different median values.
What Type of Data?
The Friedman two-way analysis of variance by ranks requires ordinal data.
Test Assumptions
- The presentation of the k experimental conditions should be random or counterbalanced.
- If dealing with matched samples, the subjects should be randomly assigned to the k experimental conditions.
Test Process
Step 1: Formulate the null and alternative hypotheses. The null hypothesis claims that the k population medians are equal. The alternative hypothesis claims that at least two of the k population medians are different.
Step 2: Compute the test statistic, a chi-square value. It is computed as follows:

The ranks themselves are obtained by ranking each of the k scores of a subject within that subject. That is, an individual’s scores in each of the k conditions are ranked from highest to lowest (or lowest to highest) for that particular individual. See the example below for more explanation.
Step 3: Obtain the p-value associated with the calculated chi-square statistic. The p-value indicates the probability of observing a chi-square value equal to or larger than the observed chis-square value from the sample under the assumption that the null hypothesis is true. The degrees of freedom for this test are k – 1.
Step 4: Determine the conclusion. If the p-value is larger than the prespecified α-level, fail to reject the null hypothesis (that is, retain the claim that the population medians are equal). If the p-value is smaller than the prespecified α-level, reject the null hypothesis in favor of the alternative.
Example
The example I want to look at today is similar to last week’s. The data come from a previous semester’s STAT 213 grades. The class had two midterms and I final. Taking a sample of n = 20 from this class, I wanted to see if the average test grades were all similar across all three tests or if there were some statistically significant differences. Let α = 0.05.
H0: θmidterm1= θmidterm2 = θfinal
Ha: at least one pair of medians are different
The following table shows the midterm and final scores as well as the corresponding within-subject ranks.
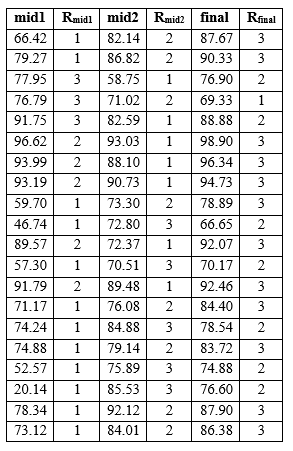
Computations:

Here, our computed p-value is smaller than our α-level, which leads us to reject the null hypothesis, which is the claim that the median grade is equal across the three tests.
Example in R
No example in R this week, as this is probably easier to do by hand than using R!
You had me at “survey”
Hi. Here’s a music survey thingy. ‘Cause I’m too anxious to blog about anything else.
So, the rules are: put your MP3 player, iTunes, Spotify, etc. on shuffle & list the first 9 songs. NO SKIPPING! You must also include your favorite lyric from each song.
Just Give Me a Reason – P!nk
Now you’ve been talking in your sleep, oh, oh
Things you never say to me, oh, oh
Tell me that you’ve had enough
Of our love, our love
Pompeii – Bastille
But if you close your eyes,
Does it almost feel like
Nothing changed at all?
And if you close your eyes,
Does it almost feel like
You’ve been here before?
Sun & Moon – Above & Beyond
I’m sorry baby
You were the sun and moon to me
I’ll never get over you, you’ll never get over me
Your Love – Nicki Minaj
Find me in the dark
I’ll be in the stars
Find me in your heart
I’m in need of your love
Your Love, your love, your love, your love
Crushcrushcrush – Paramore
Nothing compares to a quiet evening alone
Just the one-two of us, who’s counting on
That never happens
I guess I’m dreaming again
Avalanche – WALK THE MOON
You got a look in your eyes
I knew you in a past life
One glance and the avalanche drops
One look and my heartbeat stops
22 – Taylor Swift
Yeah,
We’re happy, free, confused, and lonely in the best way
It’s miserable and magical
Oh, yeah
Breezeblocks – alt-J
Muscle to muscle and toe to toe
The fear has gripped me but here I go
My heart sinks as I jump up
Your hand grips hand as my eyes shut
Buildings and Mountains – The Republic Tigers
How do cities understand?
We drink our wine and wonder why we’re really here
What’s the point of even asking?
You take the good and bad and make the best of it
You want more recipes? YOU KNOW YOU DO
DON’T MAKE ME TURN THIS BLOG AROUND AND GO HOME, YOUNG MAN
- Tasty looking eggs on toast.
- Everything muffins? Yes.
- Holy crap, these look good. I’m a hummus junkie.
- Mac and cheese!
- Cheesy sticks
- Fettuccine Cauliflower Alfredo!
- Buttered noodles.
I’m addicted to FoodGawker, sorry.
If variety is the spice of life, then GET ME OFF THIS FLAVOR TRAIN
So Pokemon Go is fantastic and you’re going to have to deal with me talking about it every once and awhile, ‘cause I enjoy playing it and so does Nate and we go on Pokemon-catching adventures ‘cause we’re Real Adults™ with Real Adult Responsibilities and Life Goals©.
Here are some pictures of Pokemon in random places!
Ghastly in the bathroom.

Caterpie in our living room.

Pidgey in the hallway in the math department.

And Pidgey on my textbook.

PIDGEY GO THE HELL AWAY I NEED TO WORK

A Zubat near the hospital.

OH AND I WAS A GYM LEADER FOR LIKE FIFTEEN MINUTES.
Nate and I are still pretty low level compared to a lot of people I’ve seen (give us a break, the game legally launched in Canada just a few days ago and we didn’t download an illegal version beforehand). In fact, we both just hit level 5, so we wanted to try out a gym.
We went walking around late tonight and eventually headed toward the gym at the hospital. It took us a few tries to finally figure out how things worked, but I eventually took control of the gym with my Staryu. Proof:

I got demolished very shortly after this by people who had MUCH stronger Pokemon, but hey, it was fun while it lasted, haha.
I love this game.
Edit: holy crap, the first egg I hatched gave me a Pikachu. Rockin’!
Learnin’
Want to figure out your learning style? Try this questionnaire! Some of the questions were hard for me to answer, but most of them were pretty obvious in my case. Here’s the breakdown of my results.

I’m surprised; I figured I’d definitely be highest on the aural scale, but that’s clearly my lowest. Strange.
Pokemon GO?
More like Pokemon GO DOWNLOAD THIS APP IT IS SUPER COOL AND SUPER FUN AND IF YOU DON’T BELIEVE ME HERE’S A PICTURE OF MY FIANCÉ WITH A PIDGEY

(It’s dark in that picture ‘cause we were walking around until 11 PM catching Pokemon and being awesome)
Seriously, though. After a glitchy first few days, Pokemon Go is up and running (legally) in Canada. And you can tell. I took a walk down by the river today and there were literally groups of people wandering around searching for Pokemon to catch. I’ve heard people diss this game ‘cause it’s increasing the number of people staring at their phones while out in public, but really? The people out wandering around in the park are the same people you’d complain about never leaving the house. I really enjoy how there are already so many people just outside and playing this game. It makes me super happy.
I highly recommend giving it a play!
Week 29: The Single-Factor Within-Subjects Analysis of Variance
Let’s change focus a bit this week and look at some ANOVA-related tests for dependent samples. We can start with the single-factor within-subjects analysis of variance!
When Would You Use It?
The single-factor within-subjects analysis of variance is a parametric test used to determine if, in a set of k dependent samples, at least two samples represent populations with different mean values.
What Type of Data?
The single-factor within-subjects analysis of variance requires interval or ratio data.
Test Assumptions
- The sample of subjects has been randomly chosen from the population it represents.
- The distribution of data in the underlying populations for each experimental condition/factor is normal.
- The assumption of sphericity is met.
Test Process
Step 1: Formulate the null and alternative hypotheses. The null hypothesis claims that the k population means are equal. The alternative hypothesis claims that at least two of the k population means are different.
Step 2: Compute the test statistic, an F-value. To do so, calculate the following sums of squares values for between-conditions (SSBC), between-subjects (SSBS), and the residual (SSR):

Then compute the mean squared difference scores for between-subjects (MSBC), between subjects (MSBS), and the residual (MSR):

Finally, compute the F statistic by calculating the ratio:

Step 3: Obtain the p-value associated with the calculated F statistic. The p-value indicates the probability of a ratio of MSBC to MSR equal to or larger than the observed ratio in the F statistic, under the assumption that the null hypothesis is true. Unless you have software, it probably isn’t possible to calculate the exact p-value of your F statistic. Instead, you can use an F table (such as this one) to obtain the critical F value for a prespecified α-level. To use this table, first determine the α-level. Find the degrees of freedom for the numerator (or MSB; the df are explained below) and locate the corresponding column on the table. Then find the degrees of freedom for the denominator (or MSE; the df are explained below) and locate the corresponding set of rows on the table. Find the row specific to your α-level. The value at the intersection of the row and column is your critical F value.
Step 4: Determine the conclusion. If the p-value is larger than the prespecified α-level (or the calculated F statistic is larger than the critical F value), fail to reject the null hypothesis (that is, retain the claim that the population means are all equal). If the p-value is smaller than the prespecified α-level, reject the null hypothesis in favor of the alternative.
Example
The example I want to look at today comes from a previous semester’s STAT 213 grades. The class had two midterms and I final. Taking a sample of n = 30 from this class, I wanted to see if the average test grades were all similar across all three tests or if there were some statistically significant differences. Let α = 0.05.
H0: µmidterm1 = µmidterm2 = µmidterm3
Ha: at least one pair of means are different
Computations:

For this case, the critical F value is 3.15. Since the computed F value is larger than the critical F value, we reject H0 and conclude that at least two test grades have population means that are statistically significantly different.
Book Review: The Catcher in the Rye (Salinger)
It’s time for some good old Salinger today!
Have I read this before: Yes! I’ve actually read this twice before—once in high school during my “I am 2 cool 4 school” phase where I hid out in the bathroom during lunch and read books like Catcher in the Rye, and again in 2012 when I was in Tucson.
Review: Oh, Holden Caulfield. I really like the style of this book, how “casual” it’s written and how it’s basically almost like Holden’s stream of consciousness as he goes through the week. I guess that casual nature is part of why the book is considered a classic, though, eh? I also like his snarky humor throughout.
Favorite part: “‘How exciting,’ old Lillian said. Then she introduced me to the Navy guy. His name was Commander Blop or something. He was one of those guys that think they’re being a pansy if they don’t break around forty of your fingers when they shake hands with you. God, I hate that stuff.” I just really like that line, haha.
Rating: 7/10
MATERIAL GIRL
‘SUP, FOOLS?
I have nothing of interest to blog about today, so you get another “here’s crap I’d buy if I had extra money” list. Enjoy.
A poster based on the movie Sunshine
As soon as these are back in stock, I’m getting one!
I already have a walking backpack, but this would be a good backup.
This site has a lot of cool things!
Okay, that’s all. Sorry my blogs suck.
Lenses
Since approximately a year ago, whatever coating that’s on my lenses has been slowly flaking off. First it was just two fairly small spots near the middle of my vision on my right lens, but it pretty rapidly progressed to just giant spots of blurriness on both lenses. Check it:


Yes, those are perfectly clean. All those marks/scratches are places where the coating’s flaked off.
HOWEVER.
Today I finally got some brand new, scratch-free, “holy crap I can finally see clearly” lenses. WOO!
I have no idea what was up with my old ones. That’s never happened before, and I’d gone to the same optometrist in Moscow since I was born, basically.
20,000 Leagues Under the C-Train
Interesting:
Book Review: Native Son (Wright)
Book review time! Let’s look at Native Son by Richard Wright.
Have I read this before: I have! I read it in high school sometime. 11th grade? 12th grade? I think it was 12th grade, but I’m not totally sure.
Review: I’m a white chick from Idaho, so I don’t know how valid my opinion is on any of this, but given what’s been going on in the US with the Black Lives Matter movement, I think this is a book that everyone in the country should read right now. Wright puts into words a concept that I think is very central to BLM but is very difficult to understand or even express (especially if you’re white? I don’t know). He’s not using it as an excuse for Bigger’s actions, but he uses it as a way to explain why Bigger did what he did without even knowing why he did what he did. If that makes any sense at all.
Favorite part: There are a few, all related to what I was just talking about.
(This is Jan talking, a white man who actively supports the Civil Rights movement) “I don’t hate you for trying to blame this thing on me…maybe you had good reasons…I don’t know. And maybe in a certain sense, I’m the one who’s really guilty…” (…) “Bigger, I’ve never done anything against you and your people in my life. But I’m a white man and it would be asking too much to ask you not to hate me, when every white man you see hates you.”
(More Jan) “It taught me that it’s your right to hate me, Bigger. I see now that you couldn’t do anything else but that; it was all you had.” (…) “I was in jail grieving for Mary and then I thought of all the black men who’ve been killed, the black men who had to grieve when their people were snatched from them in slavery and since slavery. I thought that if they could stand it, then I ought to.”
This conversation about Bigger:
“A grave wrong has been done to two people who’ve helped Negroes more than anybody I know.”
“I sympathize with you, Mr. Dalton,” Max said. “But killing this boy [Bigger] isn’t going to help you or any of us.”
“I tried to help him,” Mr. Dalton said.
“We wanted to send him to school,” said Mrs. Dalton faintly.
“I know,” Max said. “But those things don’t touch the fundamental problem involved here. This boy comes from an oppressed people. Even if he’s done wrong, we must take that into consideration.”
Rating: 7/10
CAT
LOOK AT HOW CUTE JAZZY IS.

That is all.
Week 28: The van der Waerden Normal-Scores Test for k Independent Samples
Let’s look at another nonparametric test this week with the van der Waerden normal-scores test for k independent samples!
When Would You Use It?
The van der Waerden normal-scores test for k independent samples is a nonparametric test used to determine if k independend samples are derived from identical population distributions.
What Type of Data?
The van der Waerden normal-scores test for k independent samples requires ordinal data.
Test Assumptions
- Each sample of subjects has been randomly chosen from the population it represents.
- The k samples are independent of one another.
- The dependent variable (the values being ranked) is a continuous random variable.
- The samples’ underlying distributions are identical in shape (but do not necessarily have to be normal).
Test Process
Step 1: Formulate the null and alternative hypotheses. The null hypothesis claims that the k groups are derived from the same population. The alternative hypothesis claims that at least two of the k groups are not derived from the same population.
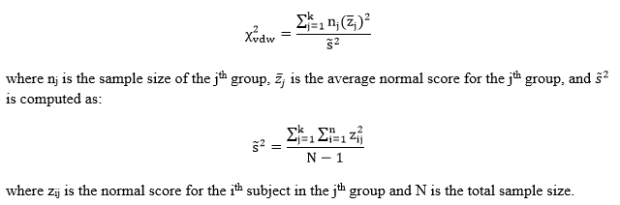
Step 2: Compute the test statistic, a chi-square value. This value is computed as follows:
Step 3: Obtain the p-value associated with the calculated chi-square statistic. The p-value indicates the probability of observing a chi-square value equal to or larger than the observed chi-sqaure value from the sample under the assumption that the null hypothesis is true. The degrees of freedom for this test are k – 1.
Step 4: Determine the conclusion. If the p-value is larger than the prespecified α-level, fail to reject the null hypothesis (that is, retain the claim that the k groups are derived from the same population). If the p-value is smaller than the prespecified α-level, reject the null hypothesis in favor of the alternative.
Example
The example for this test is the same as the one from last week. Looking at my songs that are rated five stars, I wanted to see if the electronic, alternative, and “other genre” songs were derived from the same population. Here, n = 50 and let α = 0.05.
H0: the k = 3 groups are derived from the same population.
Ha: at least two of the k = 3 groups are not derived from the same population.
The values necessary for this test are displayed in the following tables. The explanations follow.


The first column just contains the raw data values.
The second column contains the ranks. To obtain the ranks of the songs, I did the following steps:
First, I sorted the songs by playcount.
Second, I ranked the songs from 1 to 50 based on their playcount, with 1 corresponding to the song with the highest playcount and 50 corresponding to the song with the lowest playcount. Note that I could have done this the opposite way (1 corresponding to the least-played song and 50 corresponding to the most-played song; the resulting chi-square value would be the same).
Third, I adjusted the ranks for ties. Where there were ties in the playcount, I summed the ranks that were taken by the ties and then divided that value by the number of tied values. I then replaced the original ranks with the newly calculated value.
The third column contains the normal score values for each rank-order. To obtain these values, I did the following:
First, I took each individual rank and divided it by N + 1 = 51. This gave me a proportion that could be conceptualized as the percentile for that score (if multiplied by 100).
Second, I found the standard normal score (z-score) that corresponded to that percentile and input that as the entry for column 3.
Computations
The following three values are the sums of the normal scores for each genre:
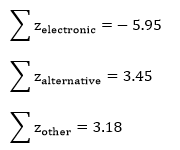
And these three values are the average normal scores for each genre:
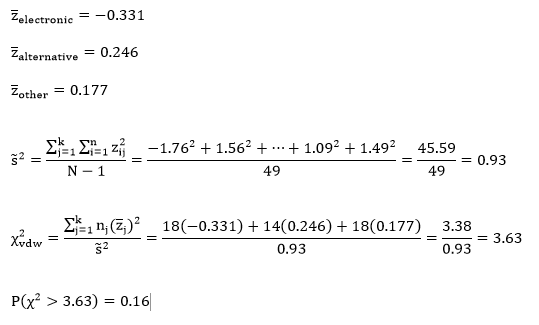
Here, our computed p-value is greater than our α-level, which leads us to fail to reject the null hypothesis, which is the claim that the three genre groups are derived from the same population.
Example in R
No example in R this week, as this is probably easier to do by hand than using R!
OH GOD I’M SO BAD AT THIS

I thought I was cool. I am not.
The Gat Greatsby
Here’s an interesting article talking about the difference in the workout/calorie burn for walking versus running. Basically, common sense is right: running burns more calories than walking if both are done over the same distance. The author looked at comparing the net calorie burn of running versus walking. Net calorie burn is the total calorie burn minus the resting metabolic calories that your body would have burned during the time of the workout even if you hadn’t been working out at all The relative net calorie burn of running a 9:30 mile is approximately the same as walking a 19:00 mile.
However, the author notes that walking should not be discounted as a good source of exercise—especially if the walking is done at a rapid pace. He states that at fast paces, walking is actually harder than running. This is because the body is really not designed to walk quickly. Moving quickly is what running is for! So trying to force your body to walk at a very fast pace actually increases heart rate, oxygen consumption, and calorie burn.
So yay for fast walking! I like walking better than running for exercise anyway, ‘cause I can easily walk at 4.3 mph or faster for upwards of four hours, but make me run at a reasonable speed for about an hour and I’m dead.
Pokemon
So Pokemon Go has been out for a little over a day now and I already want it. I hadn’t really been paying much attention to it before now, just because I thought it was just another “regular” Pokemon game (and in my opinion, nothing can beat Crystal) and because I basically have zero time to play any games (I say as I start a new Sim family).
But now that I’ve seen what it’s all about, I needs it. But it’s not even out in Canada right now, so I’ll just have to wait until Niantic decides that Canadians can be trainers, too.
(Hurry up, Niantic.)
Stuff of Olde
HAHA. So.
I was digging through a drawer of all my old notebooks/papers/whatever/crap ‘cause I needed to find something specific for reasons I won’t go into here.
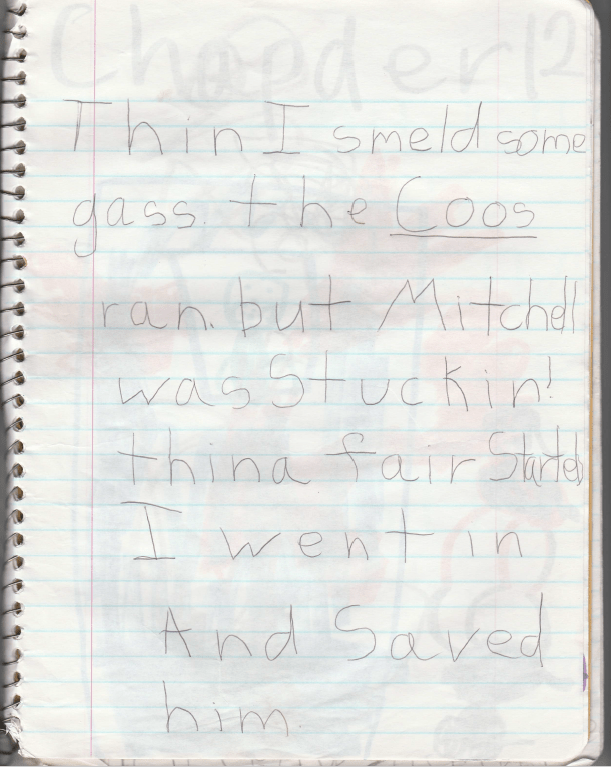
But at the bottom of the drawer, I found the one old journal I kept from first grade. I wrote a lot in first grade. A lot. I probably had over 20 journals full of coo stories (what’s a coo?). Granted, my writing was HUGE back then and I padded the stories with a lot of illustrations, but it was still quite a lot of writing for a first grader, in my opinion.
So in the spirit of nostalgia, have some scanned pages of the notebook I found today.