MATHS MATHS MATHS
This is hysterical. Also very accurate based on my experiences taking upper level math courses. Though the only class I ever had that announced the grade breakdown of exams was my computer science class.
“This is Calculus 7. Today we’re going to be doing some mathematics.”
“It’s a conceptual move, not an algebraic one.”
Math-inclined friends, I need your help!
So we’re doing trigonometric integrals in calculus and one of our homework problems is this little dude:

We rushed through this section of the chapter this morning ’cause we’re behind schedule and I’m a little shaky on them (also I’m dumb), so I went to the calc room in Polya to get some help. I showed one of the tutors in there this integral.
I told him how I thought we should start: since (1-cos2x) is the numerator of the half-angle formula for sin2x, we could multiply both sides of the half-angle formula to change (1-cos2x) to 2sin2x and then go from there.
He said he’d never even thought about solving it like that, but when I asked him what the “normal” method would be for this integral, he didn’t know.
So is there another way of solving this?
Cake is a Lie, Pi is a Constant
Oh look, it’s Pi Day.
Have you heard, then, of Tau Day?
“The true circle constant is the ratio of a circle’s circumference to its radius, not to its diameter. This number, called τ (tau, is equal to 2π, so π is 1/2τ—and March 14 is thus Half Tau Day. (Of course, June 28, or 6/28, is Tau Day itself.) Although it is of great historical importance, the mathematical significance of π is simply that it is one-half τ.”
http://www.math.utah.edu/~palais/pi.pdf
Interesting notion. Canadian news websites: reporting the slightly quirky version of Pi Day for all of us to enjoy.
I Love Uncyclopedia
Uncyclopedia is great. Spent the night browsing it, feel substantially better than I did this afternoon.
From the “glossary of mathematical terms” section:
Absolute Value: The price of a bottle of vodka.
Cartesian Coordinates: Coordinates that one thinks are correct, therefore they must be…
Decagon: The cards are missing.
Euler’s Formula: The squeaky wheel gets the grease.
Infinity: A big fuckin’ number
From the “statistics” page:
“In the meantime, you should have a look at some FUCKIN POLLS (1/5) “
“Type I Error: Getting statistically significant results.
Type II Error: Getting statistically significant results, lying about the results, and getting caught.
Type III Error: Getting statistically significant results and forgetting to write them down.
Type IV Error: Getting a type I, II, or III error and not realizing it.
Type V Error: You have no fucking idea what you’re doing, do you?”
Newton’s page is practically all about apples. It’s freaking hilarious.
“Four years later, Newton presented his thesis, On The Scrumptiousness Of Apples, to the university. Due to the prevailing low standards in science at the time, it was accepted and Newton graduated.”
“Newton was distraught and flew immediately into a violent rage. He ran into the local market and turned over a cartload of apples shouting, ‘run my pretties, I have freed you!’ This is believed to be the origin of the popular saying ‘upsetting the apple cart’ as well as the less well known phrase ‘don’t go mad and start humping apples like Newton did.’”
And Hume:
“Showing his potential from an early age, he had disproved the existence of God, society, and Asia while still a mere toddler, and the existence of over 30% of all known objects by his eighth birthday. Aristotle had not even learnt to tie his shoe-laces until he was nine.”
I still think Vancouver’s page is the most hilarious thing ever, but Surrey’s article is like 100% accurate. “The city’s current motto is ‘for the love of God, stay the fuck out!’
Today’s song: Ellens Gesang III, D. 839 [Ave Maria] by Barbara Bonney & Geoffrey Parsons
Good lord…
I think Sir Ronald Fisher is the statistics equivalent to Leibniz in my mind. Check it:
…this paper laid the foundation for what came to be known as biometrical genetics, and introduced the very important methodology of the analysis of variance, which was a considerable advance over the correlation methods used previously.
The freaking ANOVA, people.
In addition to “analysis of variance”, Fisher invented the technique of maximum likelihood and originated the concepts of sufficiency, ancillarity, Fisher’s linear discriminator and Fisher information. His 1924 article “On a distribution yielding the error functions of several well known statistics” presented Karl Pearson’s chi-squared and Student’s t in the same framework as the Gaussian distribution, and his own “analysis of variance” distribution Z (more commonly used today in the form of the F distribution). These contributions easily made him a major figure in 20th century statistics.
Do you know what the Z distribution is? It’s used for setting confidence intervals around correlation estimates. Since a correlation is bound by -1 and 1, any sampling distribution with a mean correlation other than zero has a skewed distribution, and thus requires unsymmetrical confidence intervals to be set. Fisher’s Z distribution is a non-linear transformation of correlations that FORCES THEM INTO A NORMAL DISTRIBUTION in which you can set symmetrical confidence intervals, and then you can TRANSFORM THOSE LIMITS BACK and get confidence intervals in the original sampling distribution of correlations.
Seriously, that’s pretty freaking amazing. This guy rocked. Go search him in Wikipedia and see the massive list of “see also” pages.
Benford’s Law: The Project
Exploratory Data Analysis Project 3: Make a Pretty Graph in R (NOT as easy as it sounds)
Seriously, the code to make the graphs is longer than the code to extract the individual lists of digits from the random number vector.
Anyway.
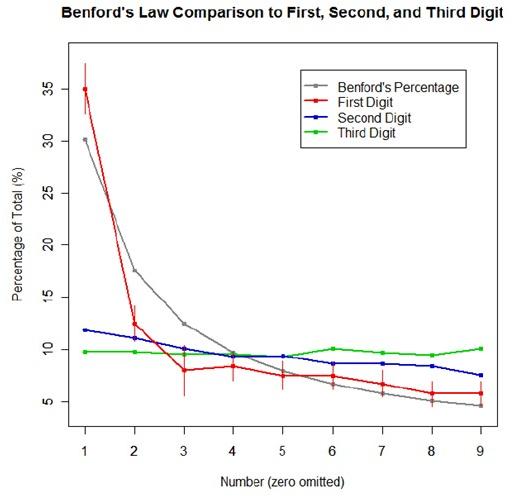
The goal was to show a simple yet informative demonstration of Benford’s Law. This law states that with most types of data, the leading digit is a 1 almost one-third of the time, with that probability decreasing as the digit (from 1 to 9) increases. That is, rather than the probability of being a leading digit being equal for each number 1 through 9 the probabilities range from about 30% (for a 1) to about a 4% (for a 9).
For the first graph, I wanted to show how quickly the law breaks down after the leading digit (that is, I wanted to see if the second and third digit distributions were more uniform). I took a set of 10,000 randomly generated numbers, took the first three digits of each number, and created a data set out of them. I then calculated the proportion of 1’s, 2’s, 3’s…9’s in each digit place and plotted them against Benford’s proposed proportions. Because it took me literally two hours to plot those stupid errors of estimate lines correctly (the vertical red ones), I just did them for the leading digit.
For the second graph, I took a data table from Wikipedia that listed the size of over 1,000 lakes in Minnesota (hooray for Wiki and their large data sets). I split the data so that I had only the first number of the size of the lakes, then calculated the proportion of each number. I left out the zeros for consistency’s sake. I did the same with the first 10,000 digits of pi, leaving out the zeros and counting each number as a single datum. I wanted to see, from the second graph, how Benford’s law applied to “real life” data and to a supposedly uniformly-distributed set of data (pi!).

Yes, this stuff is absolutely riveting to me. I had SO MUCH FUN doing this.

