TWSB: Hot n’ Spicy Pi
Today’s science blog is about pi!
But why? It’s not pi day or casual pi day or tau day.
Well, because today’s date occurs in pi as well: at position 336 (not counting the “3.”). In fact, you can easily find if any sequence occurs in pi (and if so, where) using this cool tool:
http://www.angio.net/pi/piquery (searches the first 200,000,000 digits).
Anyway.
I found that cool site by reading an article by the Mathematician at askamathematician.com. The question asked was, “Since pi is infinite, do its digits contain all finite sequences of numbers?”
The answer: while pi is infinite and does not contain an infinitely repeating sequence, it has yet to be proven that every digit from 0-9 occurs an unlimited umber of times in pi’s decimals. Thus, it hasn’t been determined that pi contains every single finite sequence of numbers.
However, though pi isn’t random, its digits appear to show up randomly in sequence such that any given chunk of pi has approximately equal numbers of digits 0 through 9 (I tried this out, it’s true!), which indicates that if that’s the case throughout and pi is indeed infinite, then according to the Mathematician, “there is a probability of 100% that such a number contains each and every finite sequences of digits, and pi has the appearance of being statistically random.”
Pi Day!
I had to. I’m so sorry.
Pi Day (sung to the tune of Rebecca Black’s Friday)
March 14th, waking up in the morning
Something’s goin’ down, but I can’t tell what
Gotta pack my bag, gotta go to class
Takin’ a glance at the calendar
Lookin’ at the date, gettin’ all excited
Gotta go get my math homework
Gotta do my trig, Gotta do geometry
Seeing circles on the page
Circumferences are all the rage
e, phi, zeta, K,
Which constant should I use?
It’s Pi Day, Pi Day
Gotta get down on Pi Day
Everybody’s lookin’ out for the area, area
Pi Day, Pi Day
Doin’ math on Pi Day
Everybody’s solvin’ problems for the area
Algebra, algebra (yeah)
Calculus, calculus (yeah)
Math, math, math, math
Lookin’ forward to the answer
1:59 is the time we wait for
Gotta celebrate, best day of the year
Math, math, think about math
Think circumference
I got this, you got this
You’ve got your T-I-eight-four
Just type it, calculate it
Now you know it
Seeing circles on the page
Diameters are all the rage
e, phi, zeta, K,
Which constant should I use?
It’s Pi Day, Pi Day
Gotta get down on Pi Day
Everybody’s lookin’ out for the area, area
Pi Day, Pi Day
Doin’ math on Pi Day
Everybody’s solvin’ problems for the area
Algebra, algebra (yeah)
Calculus, calculus (yeah)
Math, math, math, math
Lookin’ forward to the answer
Yesterday was boring, boring
But today is Pi Day, Pi Day
We-we-we so excited
We so excited
We gonna do some math today
Tomorrow it’s over
But July 22nd’s soon
I don’t want this party to end
3.14159
So useful of a number
Transcendental
I’m addin’, solvin’
See spheres, find volumes
Wit’ my pi up on my side
In my free time I do some geometry
Pi r squared, r squared, wanna cheer
Check my date, it’s Pi Day, it’s a great day
We gonna do math, c’mon, c’mon, y’all
It’s Pi Day, Pi Day
Gotta get down on Pi Day
Everybody’s lookin’ out for the area, area
Pi Day, Pi Day
Doin’ math on Pi Day
Everybody’s solvin’ problems for the area
Algebra, algebra (yeah)
Calculus, calculus (yeah)
Math, math, math, math
Lookin’ forward to the answer
It’s Pi Day, Pi Day
Gotta get down on Pi Day
Everybody’s solvin’ problems for the area
Pi Day, Pi Day
Doin’ math on Pi Day
Everybody’s solvin’ problems for the area
Algebra, algebra (yeah)
Calculus, calculus (yeah)
Math, math, math, math
Everybody’s solvin’ problems for the area
Difficult to do because HORRIBLE SONG. Pi deserves better, so here’s my other math-related parody.
Pi vs. e
So a couple days ago I blogged about why I hadn’t ever analyzed e the same way I had analyzed pi awhile back.And today I said to myself, “hey you idiot, what’s your malfunction? Just break up the million digits into chunks, summarize the numbers within, and then combine all the info in an R-friendly table?”
Yeah, what a genius, eh? Proof that any moron can get a Master’s degree.
(Haha, holy hell, I have a Master’s degree. I think that’s the first time I’ve ever written that.)
Anyway.
So I found a list of the first 1 million digits of e here, broke the list into 10 sections of 100,000 digits, summarized the frequencies, made a fancy-shmancy table, plugged it into R, and did an analysis like the one I did to pi. Specifically, I wanted to see exactly how uniform the distribution of digits were in a number with a non-repeating decimal.
Rather than just showing you the results from e (and to have an excuse to screw around with R graphics), I drudged up the data from my pi analysis so I can present to you a few side-by-side comparisons.
Off we go! And as always, pictures are clickable for fullsize.
Here is a table of the digit frequencies, or how often each number (0 through 9) occurred within the first million digits of the two irrational numbers. Since the distribution of these digits is presumably uniform, the expected frequency for each digit is 100,000. As you can see, there’s a slight deviation from this because my sample size is comparatively very tiny.

Cool, huh? And here are comparative pie charts, which aren’t useful at all because the differences in frequencies—both within and across the two irrationals—are so small compared to the number of digits overall. But they were fun to make and they’re pretty, so you get them anyway.


Here’s a better graphic to show a comparison of the frequencies. Number of instances on the y-axis, digits on the x-axis. The red lines/points represent frequencies for e, the blue lines/points represent frequencies for pi. Look at 6. Isn’t that weird how it’s the most frequent digit in e but the least frequent in pi? And check out 3. There was only one more instance of a 3 in the first million digits of pi than there was in the first million digits of e.

How cool, eh?
MATHEMATICS!
Excuses, excuses! (or, “why Claudia sucks”)
Those of you who have been following my blog insanity for several years may remember this post, in which I analyzed pi to determine relative frequencies in the first million digits. I promised to analyze e in the same manner, but I haven’t done it yet. Know why? ‘Cause as much as I love R, R does not love large datasets. Obviously, 1 million individual digits is quite a large dataset.
Once I find a computer with SAS (that’s what I used for pi), I’ll do e. I promise.
Also, have some fun with logic.
Cake is a Lie, Pi is a Constant
Oh look, it’s Pi Day.
Have you heard, then, of Tau Day?
“The true circle constant is the ratio of a circle’s circumference to its radius, not to its diameter. This number, called τ (tau, is equal to 2π, so π is 1/2τ—and March 14 is thus Half Tau Day. (Of course, June 28, or 6/28, is Tau Day itself.) Although it is of great historical importance, the mathematical significance of π is simply that it is one-half τ.”
http://www.math.utah.edu/~palais/pi.pdf
Interesting notion. Canadian news websites: reporting the slightly quirky version of Pi Day for all of us to enjoy.
Deconstructing Pi
Today I did something fun (and something that crashed SAS at least 10 times): I decided to deconstruct pi to the 1 millionth digit. Why? I wanted to see if the numbers 0-9 appeared nearly uniformly throughout this fraction of such an infinitely long number. I wanted to test the hypothesis that a large enough sample size with the instances seemingly “random” would produce a much less leptokurtic (bell curve-shaped) distribution.
I also like the word “pi.”
STEP BY STEP PROCESS!
First I went here to get the first million digits.
Then I used the handy-dandy CTRL-H “find and replace” command to put spaces behind each digit so that SAS could read each one as a distinct piece of datum.
So after SAS crashing on me like 4 billion times (it took awhile to be able to input the most amount of data but not have it flip out—no seriously, this took like three hours), I finally got all the data into SAS and analyzed it. Here are codes/output!
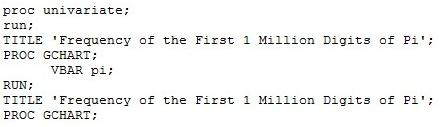
As you all know, the mean of numbers 0-9 is 4.5. When n=1,000,000,the mean of all this data is 4.499934, about as close to 4.5 as you can get. And there’s practically no skewness, either.
Here’s the bar chart:

And, appropriately, here’s the pie chart:
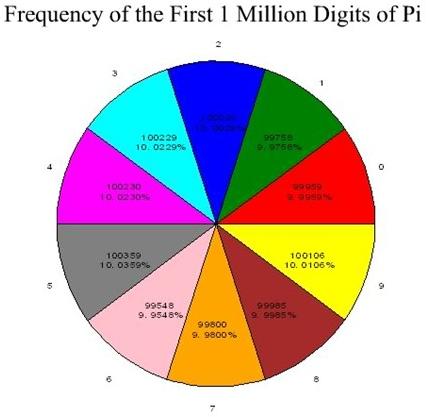
How freaking GORGEOUS is that uniformity?! I mean, LOOK at it!
Breakdown by smallest to largest frequency:
6: 99,548
1: 99,758
7: 99,800
0: 99,959
8: 99,985
2: 100,026
9: 100,106
3: 100,229
4: 100,230 (ONE instance difference between digits 3 and 4! OMG!)
5: 100,359
The power of the large sample size, my friend. Cherish it. Admire it. Worship it.
I’m done here.
Piece of Pi
Boredom + Rock Band + geekiness = this.
Piece of Pi (sung, of course, to Boston’s Peace of Mind)
Now if you’re feelin’ kinda low ‘bout the math you’ve been doing
Answer’s coming much too slow
And you need a break but somehow you keep calculatin’
Solution’s something you need to know
Chorus
I understand about logarithms
And I don’t care if I can’t derive
People livin’ with long division
All I want is to know a piece of pi
Now you’re tryin’ to find the key to this integration
Thought you knew this all by heart
There are so many techniques that you are now debatin’
Try some integration by parts
[Chorus]
Take the log of x!
Take the log of x!
Yeah, yeah, yeah, yeahhh!
[Guitar solo needs no math puns!]
Now everybody’s all hung up ‘bout this 5-by-5 matrix
Actin’ like a bunch of fools
Seems like they forgot all of the algebra tricks
Why don’t they just use Cramer’s Rule?
[Chorus]
Take the log of x!
Take the log of x!
LOG OF X!!!
Yeah.

