Mathin’
I FOUND SOMETHING ELSE I WANT.
IT IS A MATH STENCIL.
IT IS GLORIOUS.
CAPS LOCK.
Look at this. Look at those lower case Greek letter stencils. I’ve needed those so many times in the past.
Freaking zeta.

(Image from Tumblr.) And the curly braces. THE CURLY BRACES, PEOPLE.
Edit: Okay, found the motherlode.
This is glorious.
Slippery Slopes
So remember that post I did awhile back that talked about why we use “m” for slope? Well, I mentioned in it that some other countries use different letters. Here’s a handy dandy map of those different letters, based on this info.

So…consider this a follow-up blog?
Swiggety swog, what’s in the blog?
Today we learned how to use complex analysis to solve real-values integrals that would otherwise be very difficult to solve.
Example:

No complex variables in sight in that integral, right (assuming x is real-valued, haha)? Well you can CONVERT THIS TO A COMPLEX-VALUED INTEGRAL AND HAVE AN EASIER TO SOLVE PROBLEM!
That freaking blew my mind this morning in class. I’d go through the details of how to do this, but I’m a lazyass and don’t want to use Word’s equation editor to make like 30 different equations showing the steps to solve. Instead, I’ll link to Dr. Datta’s notes from class. Go to page 10 in the PDF (the page labeled “161”) for this example.
FREAKING. AWESOME.
Side note: if any of you ever end up going back to UI or know anyone who will be taking some upper-division math classes there, I highly recommend Dr. Datta. She’s very clear at explaining things, good at giving examples, gives reasonable homework, and is always willing to help.
Do ghosts enjoy Boo-lean algebra?
Remember my post on John Napier awhile back?
Well check out the Genaille-Lucas rulers, a variant of Napier’s bones. They’re used to carry out multiplication and have a really snazzy way of visually representing the “carry” part of multiplication.
Check out this example on Wikipedia.
I’m totally printing out that PDF of the rulers at the bottom of the Wiki page. Snazzy!
The Cones of Rebelling
HAHAHA, oh, Yale.
I read about the Conic Sections Rebellion quite some time ago, but I’d forgotten about it.
The rebellion refers to two incidents that occurred at Yale in 1825 and 1830. Both were students’ responses to having to draw out their own conic sections diagrams for exams rather than being able to refer to the diagrams in their textbooks.
A large number of students refused to take their final exams because of this, resulting in about 50% of the students in both the ’25 and ’30 incidents being expelled. That’s awesome.
Binary!
I’m a really visual person. That’s how I learn best, by studying diagrams or remembering the processes of things. So seeing binary addition visually is really, really helpful to me. I wish I’d found this back when I first learned this—it probably would have been less confusing, haha.
How cool is that?
Hey baby, let me expand your series
This is a really interesting read.
I am someone who has very little mathematical intuition. I mean, I think some people just have a knack for thinking about math and “math things” and for piecing bits of different types of math together. I don’t. Like, even at the most basic levels—simplifying factorial expressions, the logic behind summation rules, all that stuff. I mean, I know I’m a total idiot, but still. At least with other topics I have some degree of intuition.
And I’ve always wondered if others who actually have a more intuitive understanding of math—or at least have delved into it far enough—see advanced math (or math in general) in a different way.
Anyway. Interesting read, check it out.
Mathymaths
Do you like math?
Do you like fiction?
DO YOU LIKE THEM BOTH??
Go here! It’s a pretty comprehensive list of math-related fiction. If you so desire, you can search by keyword, genre, topic (calculus, chaos, fractals, statistics, etc.), motif, or rating in terms of literary value or math involvement.
Just a quick little blog today!
RESPECT THE TRIANGLE
So remember this Approximate Number System aptitude test I did back in 2012? I decided to try it again. I’ve been doing so much more math since then, I wondered if that would affect my performance at all.
Results:
OLD (2012)


NEW (today)
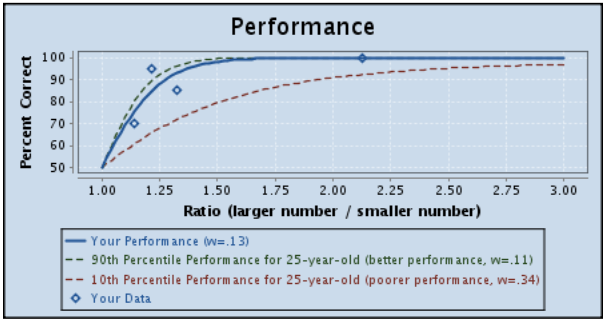

HAHA, nope. My Weber fraction (w = .13) is exactly the same. That’s hilarious.
Though to be fair, it’s 4:30 in the morning and I’m kinda hyper, so maybe that’s affecting stuff.
But I’m always like that, so maybe not.
WOOOOOOOOOOOOOOOOOOOOOOOOOOO!
“When Will I Use That?” – Calculus Edition
Alternate title: Claudia Makes Things Way More Complicated than They Need to Be Because She Sucks
We had this bonus question on our homework for Probability today:
Suppose X has a density defined by

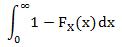
Let FX(x) be the cumulative distribution of X. Find the area of the region bounded by the x-axis, the y-axis, the line y = 1, and the curve y = FX(x).
And I was like, “Aw, sweet! Areas of regions! CALCULUS!”
So first, I had to find the cumulative distribution function (cdf) of X. Easy. It’s just the integral of the density fX(x) from negative infinity to a constant b. In this case:

With 2 ≤ b ≤ 3. So that’s my curve y. The area I’m looking for, therefore, is this (the red part, not the purplish part):

Now anyone with half a brain would look at this and go, “oh yeah, that’s easy. I can find the area of the rectangle formed by the two axes, the line y = 1, and the line x = 3, then find the area of the region below the curve from 2 to 3, and subtract the latter from the former to get the correct area.”
Which works. Area of rectangle = 3, area of region below FX(x) = .25, area of region of
interest = 2.75.
Or they could remember the freaking formula that was explicitly taught last week. Such areas can be calculated using:
But did I see either of those? Nooooooope.
I looked at the graph and was like, “how the hell do you find that?” I tried a few things that didn’t work, then realized that it would be a lot easier to figure out if I changed the integral from being in terms of x (or b, rather) to being in terms of y.
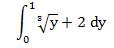
So then I just had to integrate. This gave me the right answer: 2.75!
Moral of the story: don’t complicate things. But if you do complicate things, you might actually end up in a scenario where you’ll use something that you were taught back in calculus I but didn’t ever suspect you’d actually use. I had appreciated learning the handy-dandy technique of changing variables, but I didn’t think I’d be in a situation where I’d apply it. Shows what I know, eh?
It was a nice refresher, at least. I’ve missed calculus.
I’M HYPER AND YOU CAN’T STOP ME
How complex numbers are made:
Seriously, someone take Flash away from me.
The Devolution of the Pink Pearl

This is because:
- I make a LOT of mistakes
- I’m just not good at math
- I did about 1,000 practice problems to get ready for the tests (and because calculus rules)
Common Curta-sy
“WTF is a Curta?” you may be asking.
I’ll tell you!
The Curta is a little handheld mechanical calculator introduced in 1948 by Austrian engineer Curt Herzstark (so I guess “Curta” was an easier name than “Herzstarka”). Real-life ones look like THIS (source for pic)…

…and were considered the best portable calculators until the digital ones started coming out in the 1970s.
Its design is based in part off of…(wait for it)…Leibniz’ Step Reckoner. It is able to do addition, subtraction, multiplication, division, and also square roots. What made it different from contemporary calculators was, though it employed a stepped drum mechanism like most others, Herzstark was able to create and patent a single drum that did the work of 10+ drums, thus making the Curta super compact.
I wanted to get a real one, but they’re like $400 now, so this simulator was a cool find. If you want to get all up in the Curta’s business but are intimidated by all the arrows/dials (it’s like a slide rule on steroids!), check out this manual.
Are all Aquarian baseball players pitchers?
Holy crap dudes, this is the best discussion of imaginary numbers I’ve ever heard. Listen to this, it’s really cool.
MATHFEST
“MAA MathFest 2013 will be held at the Connecticut Convention Center and Hartford Marriott Downtown in Hartford, Connecticut.”
WHAT THE CRAP IS THIS CONFERENCE AND WHY CAN’T I BE THERE?
There’s a minicourse entitled “Passion-Driven Statistics: A Supportive, Project-Based, Multidisciplinary Introductory Curriculum” and another one called “Mathematical Expeditions in Polar Science” in which “Participants will learn about many different areas of scientific research going on in the Arctic and in Antarctica, including sea ice, glaciers, ice cores, phenology, astronomy, biology, and satellite mapping.”
Math and Antarctica? Seriously?
AND DR. ARTHUR BENJAMIN (THIS GUY) IS GOING TO BE THERE?!?
Nooooooooo life is not fair, it’d cost like an entire semester’s tuition to get me to Connecticut.
I’m sad now.
!HTAM
Let’s add this to the “This is Why Claudia Shouldn’t Make Jokes” list.

Also, one of the bullet points on this guy’s “43 Ways to Start Making Money” pages is “get a job.” I can’t tell if that’s hilariously snarky or just jerk-tastic.
Who is Fubini?
I dig my calc III teacher. He’s awesome. But I wish he’d do what I wish all math teachers would do when they introduce a theorem or lemma or rule: tell us a little bit about the person responsible for it, especially if the theorem/lemma/rule is named after the dude.
Like today we talked a lot about Fubini’s Theorem. We used it in like three examples. I used it on the homework I did right after class.
All the while without knowing who the heck this Fubini guy was.
So I checked him out this afternoon. Guido Fubini was an Italian mathematician who lived from 1879 to 1943. He was pretty into geometry and calculus for most of his life and moved around in different professorships in Europe before accepting an invitation to teach at Princeton in 1939 (partially to get away from the Nazis; he was Jewish).
So what the heck is this theorem, anyway?
Well. Let’s just look at rectangular domains first (because that’s all we’ve learned so far, haha…we’re doing non-rectangular domains tomorrow). So let’s look at a pretty double integral to start.
(P.S. I’m loving this chapter on double integrals already, simply because it means I have to write more integral signs. I FREAKING LOVE THAT SYMBOL.)
Say some rectangular region R is defined by the intervals [a,b] x [c,d]. If a function of two variables z= f(x,y) is continuous over R, then we can write the volume of the solid that lies below the surface z = f(x,y) and above the rectangle R as:

Or:

Iterated integrals!
Cool? Cool. So what does Fubini’s Theorem state? Again, assuming z = f(x,y) is continuous over R and R is a rectangular region, Fubini’s Theorem allows us to switch the order of integration while still getting the same correct result at the end:

Which is pretty snazzy (there’s a few other statements in the theorem; I just chose this conclusion as the example to show here).
But what I found most interesting about this theorem is that while double integration has been around for quite a long time, this theorem was proved sometime during Fubini’s lifetime–sometime in the late 1800s or early 1900s. (I can’t find an exact date for it, but that’s mainly because my internet’s deciding to be a bitch right now). Which makes sense, I guess, considering there exist cases where this doesn’t hold and so it may not have been an “obvious” thing or may not have been easily provable…but still. Interesting passage of time before we got to this theorem.
HUZZAH CALCULUS!
I LOVE THE PIGEONHOLE PRINCIPLE ASDFDHFHJDFJFLFSGHHH
So today is the last day of classes before finals. We spent today talking about the Pigeonhole Principle in Discrete Math. The Pigeonhole Principle is one of my favorite math-related things. I’ve done a blog on the actual Principle before, but while we were talking about it today I think I realized why the conclusions you can reach from the Principle seem so counter-intuitive to people (or at least why it was so to me when I first learned of it).
Let’s take a fairly simple example to demonstrate.
Suppose I have a group of 27 individuals. According to the Pigeonhole Principle, I can state that at least two of these people will have names that start with the same letter of the alphabet. I won’t go into why this is so (you can read my version of the explanation here on my previous PP post, linked above), but even if you’re pretty familiar with it, this still seems a little counter-intuitive, doesn’t it? You think, “wait, how can that possibly be a valid conclusion? There’s no way we can guarantee that!”
Where does this aversion to this conclusion come from?
Well, originally for me, I realized it stemmed from how I actually interpreted the conclusion itself. I always automatically interpreted the conclusion as claiming, in the case above: “there will be at least one name that starts with every letter of the alphabet in my group of 27 people.”
Which, of course, is not what the conclusion says at all. There is no claim made about the dispersion of the number of names per letter other than the fact that at least one letter will be the first letter in two names. I could have the case where I have a single name beginning with each letter A-Y, and then two names that begin with the letter Z. That still fits with the conclusion. However, I could also have NO names that start with a letter A-Y and have all 27 start with the letter Z. That’s valid, too. All the conclusion tells us is that at least one letter will begin two names. It doesn’t say that all the letters have to start a name (that is, it doesn’t say that all “pigeonholes” actually have to be utilized).
Now that I’ve typed that out, it seems like a really stupid reason for having trouble understanding the Principle, so it’s probably just me who has this issue. But anyway.
Isn’t this Principle COOL either way?!
Mathed Memes
HAHAHA MY LIFE IS COMPLETE!
That parabola sure can shake its minimum.
Edit: holy freaking crap, I laughed for like ten minutes at this:
THE SLOPE! THE SLOPE! THE SLOPE IS ON FIRE!
(Yeah, I’ve pretty much given up on my titles.)
So here’s a question that you may or may not have pondered: when we write the slope-intercept equation for a line, the m in y= mx + b is our slope, right?
Why the heck do we denote it with “m”?
There’s quite a range of theories.
According to Pat from Pats’blog, the word “slope” itself is derived from the Latin root slupan for “slip.” Which makes sense when you think of what the slope actually is.
A common myth is that Descartes first used m because it was the first letter of some French word related to slope, but according to a bunch of people who speak French (and we should probably trust them about their language) the appropriate word for slope is “pente.”
Pat digs up some info from Jeff Miller, who claims that the earliest use of m dates back to 1844 when Brit Matthew O’Brien wrote “A Treatise on Plane Co-Ordinate Geometry” and Irish George Salmon published “A Treatise on Conic Sections.”
Another possibility was pointed out by John Conway, who suggested that m could stand for “modulus of slope.”
But in the end, no one’s really sure exactly when and why we got to using m for slope. I’m sure there are a fair number of mathematical symbols we use that don’t have a clear origin, but I know I’ve never really thought about m for slope before. I guess that’s because when I first learned y = mx + b I always thought m was appropriate because if you follow the trace of the letter the slope changes a whole bunch.
I was a dumb kid.
Missing: Shade of Blue. Reward if Found: Possible Counterexample.
We started Taylor series proper today, and it’s like the seventh section in a row we’ve spent on series. When our teacher wrote “Taylor Series” on the overhead some guy said, “god, when are the series going to end?”
And without thinking I said, “Never, they’re infinite!” And my teacher looked at me like, “You did not just make that joke.”
Made my day.
Also, happy birthday to Karl Pearson!
Math!
Dammit math, you’re making me cry.
Can you identify all the mathematical tidbits throughout?
Galton machine FTW at 0:59!
Zenophobia: the irrational fear of convergent sequences
I like to read about mathematicians as much as I like to read about math itself. I think the people and history behind math are just as important as the math itself. I’m sure a lot of people would debate me on that point, but I think math—the tool we use to understand the universe—can itself be understood so much more when given some context.
Heck, sometimes the simplest things can help give rise to phenomenal mathematical advancements.
Take calculus (surprise, surprise). Kepler, chilling out in the early 1600s before either Leibniz or Newton existed on the planet, was angered by a wine merchant whose methods for measuring the volume of a wine barrel was less than accurate. So he started thinking, “Hey, how do you go about calculating the volume of such a weird shape like a wine barrel, anyway?” And thus, Nova stereometria doliorum vinariorum, or New Solid Geometry of Wine Barrels, was born. He also started on the track of differentiation by wondering how one would create a wine barrel whose dimensions maximized the amount of wine the barrel could hold.
I know that’s a small example, but I think just knowing that itty bitty bit of calculus history “anchors” that bit of math in time and space. At least more so than saying “and then at one point some dudes came up with integration.”
Which is usually how it’s taught (that or, “here’s how you do integration with no context whatsoever!”).
Haha, sorry. THIS IS WHY I WANTED TO TAKE HISTORY OF MATH. I love seeing how all these different aspects of history and people and theories and everything connect. It just makes everything make so much more sense.
Annnnnnnnnnd BLOG POST!
So I’ve come to realize something. Actually, this is something that I realized quite awhile ago, but it’s still relevant: statistics is very intuitive to me. Math is not.
I can’t recall any specific instances or anything like that, but it just seems like anything statistics-related has just made sense to me on some intuitive level that a lot of things in math do not. Even back when I was first starting (like back in STAT 251), I felt like I had a more intuitive grasp on stats.
It’s like…I can explain why some elements in a variance/covariance matrix cannot be larger than someother values and it makes intuitive sense to me, but I can’t (at the same intuitive level) explain what to do with the powers when I’ve got something like (52)8.
Blah. I don’t know. I know that’s a crappy example, and it makes it hard to explain to people why I teach statistics but am still only in calc II.

