WORLD SERIES
YAY ASTROS!
That was a pretty intense World Series. I’m glad the Astros won, mainly because they hadn’t won before.
(And because of Altuve. Short people represent!)
It wasn’t quite as intense as the World Series last year, but it was still pretty awesome. Now, unfortunately, no more baseball until spring.
Hopefully the Mets will have a better season next year…
Heights
Heyooooo so I was looking for some new data to update one of my STAT 213 note sets and I decided to use the on-record heights for 500 baseball players. We’re learning about types of graphs (boxplots, histograms, etc.) and ways of describing the shape of graphs (symmetric, skewed, etc.) so I thought hey, let’s plot these heights and see what we get.

UHHHH, have you ever seen such a perfect bell-curve shape for actual data?
But here’s where it’s interesting to also look at not only the numeric summary but other plots as well. The boxplot actually shows two outliers (two players at 80 inches tall).
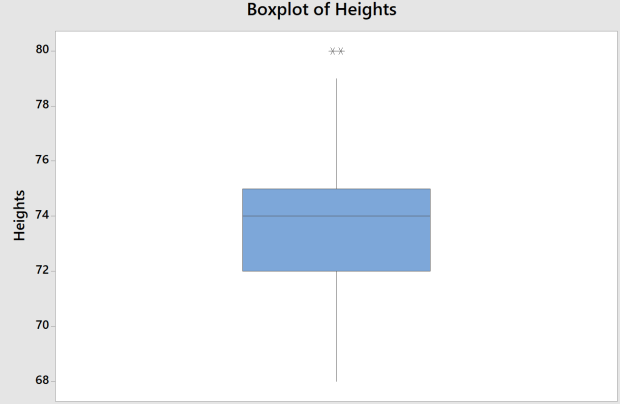
So that’s interesting as well.
Anyway. Just thought this was a super pretty distribution and I have no life so I wanted to share this with y’all.
Oh, Mets…
Hahaha, wow, when it’s all put together in a little montage like that…
That 2015 World Series, holy hell.
Baseball Stat Party Fun Time
A fun project!
At the end of the regular baseball season, you can see how many wins each team got out of the total number of games they played, and then rank the teams by their performance (who had the most wins, the second most wins, etc.).
What I want to do is see how this “real” data correlates with how many wins each team would get if they scored their average number of runs per game in every single game they played. For example, if the Mariners score an average of 4.74 runs per game, how many of their games would they have won by scoring 4.74 runs in each of those games?
The process:
- Record each team’s average runs per game (I’ll call this “RPG”) (from here)
- Sort teams from highest to lowest RPG
Now, if a team A has a higher RPG than team B, that would mean that A would win every game they play against B. So the next step was to make a grid like this and fill in the number of times each pair of teams played each other.
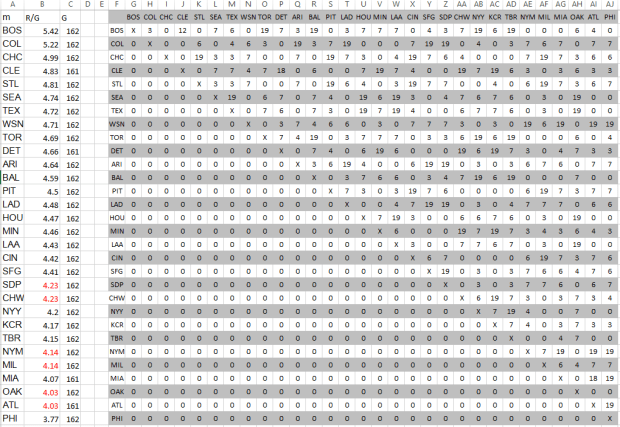
Boston has a higher RPG than the Rockies (5.42 and 5.22, respectively). So that means Boston would score 5.42 runs and the Mariners would score 5.22 runs in every game they played against each other. So of the 7 games played where these two teams faced each other, that would mean that Boston would win all of them.
I used this logic for all pairings (numbers of games per pair was obtained from here), then summed across the rows to get the “predicted” number of wins based on RPG alone.
How do they compare for the 2016 season?
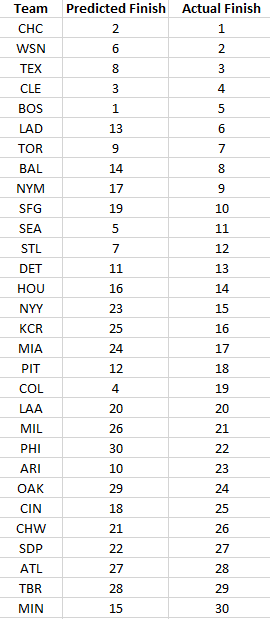
Boston (highest RPG) would win every game they played; The Phillies (lowest RPG) and the Athletics (bad luck) would lose every game they played. Bummer.
Correlation of RPG-predicted games won and actual games won: 0.640
Correlation of team rankings based on RPG-predicted games won and actual games won: 0.683
Interesting!
MLB: Do Run Totals Matter?
So after watching the Mets get eaten by the Nationals on Sunday, I wanted to see if the total number of runs a team scored throughout the course of the season had any significant correlation with the number of wins they had in that season.
(This something that has probably been done to death by actual baseball stats people, but give me a break, I’m new to this and I feel like playing around in Minitab).
First, just some general scatterplots of runs vs. wins.
By league.
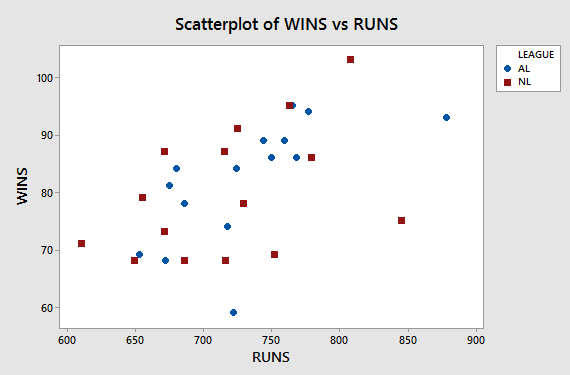
And by division.

The overall correlation between runs and wins, for all teams combined, is 0.541
(p-value = 0.002).
Now let’s break it down!
By league
- AL: 0.646 (p-value = 0.009)
- NL: 0.444 (p-value = 0.097)
By division
- ALC: r = 0.433 (p-value = 0.467)
- ALE: r = 0.746 (p-value = 0.148)
- ALW: r = 0.883 (p-value = 0.047)
- NLC: r = 0.877 (p-value = 0.051)
- NLE: r = 0.869 (p-value = 0.056)
- NLW: r = -0.119 (p-value = 0.849)
Interesting. The only significant correlations are for all the teams combined, the AL, and the ALW (and even that one’s borderline).
Anyway.
IT’S BASEBALL O’CLOCK
It’s Mets time, bitches! Hopefully they’ll win their first game. And, y’know, a good amount of the rest of their games.
(Edit: haha, wow, they murdered the Braves.)
Also, shock of shocks: I dug out my old Unreal CD and stuck it in Big Compy just to see how badly it wouldn’t work. But hey…it actually worked! And it looks shockingly good for a game from 1998.
Awesome. I just wish The Neverhood worked on this computer, too.
Reekris
Yay, USA won the World Baseball Classic!
I’m ready for the regular season to start. Nate got me all excited about baseball last year, haha.
Edit: unrelated, but important.
THE BIG YELLOW ONE IS THE SUN
Holy crap, that was the most insane baseball game! Even if you’re not a huge baseball fan (or a baseball fan at all), hopefully you got to watch at least the last game of the World Series.
Edit: If you missed it…
Ridiculous. Awesome. I’m so glad Nate and I turned on the game after Cleveland tied it (we were going to wait and watch it later, because that’s what we were doing with all the playoff/World Series games).
Yay Cubs!
The Mets, The Mets, The Mets are On Fire
Take a look at what the Mets are doing right now:

This is a graph of the Mets’ probability of making it to the postseason. As you can see, the probability had been taking a dive for most of the season, bottoming out at 6.7% on August 19th. They basically had a very, very small chance of making it.
Less than a month later, that probability has shot up to 63%. That’s pretty crazy. They’re just out of the wildcard spot now. I think it’s especially interesting when you consider that none of the other teams even remotely in contention have any huge upswings or downswings (except maybe the Cardinals).

(Sorry, I like graphs.)
(And now I can use the “sports” category for the first time in like 4 years.)
Road Trip – Day 13: San Francisco (Giants/Braves Baseball)
Today Nate and I braved the streets of San Francisco to walk along the waterfront (with the secret motive to obtain candy) and then to get to the Giants/Braves game at AT&T Park.
The waterfront was a bit less terrifying than the non-tourist part of San Fran, at least. And we found IT’SUGAR, which is pretty much the best candy store ever (though it’s more expensive than our candy store in Calgary). We each got 2+ pounds of candy, ‘cause we’re addicts awesome.
The game was super cool, too. Baseball is so weird without the TV announcers! The Braves lost, which is too bad, but it was fun. Pictures!


Tomorrow we’re getting the hell out of San Francisco as fast as we possibly can.

