So after watching the Mets get eaten by the Nationals on Sunday, I wanted to see if the total number of runs a team scored throughout the course of the season had any significant correlation with the number of wins they had in that season.
(This something that has probably been done to death by actual baseball stats people, but give me a break, I’m new to this and I feel like playing around in Minitab).
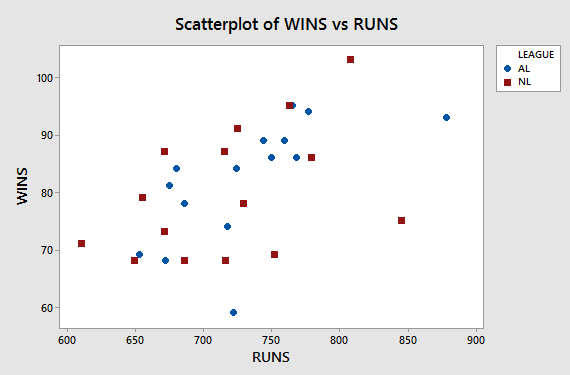
First, just some general scatterplots of runs vs. wins.
By league.
And by division.

The overall correlation between runs and wins, for all teams combined, is 0.541
(p-value = 0.002).
Now let’s break it down!
By league
- AL: 0.646 (p-value = 0.009)
- NL: 0.444 (p-value = 0.097)
By division
- ALC: r = 0.433 (p-value = 0.467)
- ALE: r = 0.746 (p-value = 0.148)
- ALW: r = 0.883 (p-value = 0.047)
- NLC: r = 0.877 (p-value = 0.051)
- NLE: r = 0.869 (p-value = 0.056)
- NLW: r = -0.119 (p-value = 0.849)
Interesting. The only significant correlations are for all the teams combined, the AL, and the ALW (and even that one’s borderline).
Anyway.

