Today we’re going to talk about our first test involving dependent samples: the t test for two dependent samples!
When Would You Use It?
The t test for two dependent samples is a parametric test used to determine if two dependent samples represent two populations with different mean values.
What Type of Data?
The t test for two dependent samples requires interval or ratio data.
Test Assumptions
- If each sample contains the same subjects (e.g., a setup that involves testing subjects at time A and then again at time B), order effects must be controlled for.
- If a matched subjects design is employed, within each pair of matched subjects, the two subjects must be randomly assigned to one of the two experimental conditions.
Test Process
Step 1: Formulate the null and alternative hypotheses. The null hypothesis claims that the two sample means are equal. The alternative hypothesis claims otherwise (one population mean is greater than the other, less than the other, or that the means are simply not equal).
Step 2: Compute the t-score. The t-score is computed as follows:

Step 3: Obtain the p-value associated with the calculated t-score. The p-value indicates the probability of a difference in the two sample means that is equal to or more extreme than the observed difference between the sample means, under the assumption that the null hypothesis is true.
Step 4: Determine the conclusion. If the p-value is larger than the prespecified α-level, fail to reject the null hypothesis (that is, retain the claim that the population means are equal). If the p-value is smaller than the prespecified α-level, reject the null hypothesis in favor of the alternative.
Example
For the data for this example, I decided to compare the age at which the internet thought I would die in 2011 to the age at which the internet thinks I would die in 2016. That is, I took 8 different online “death tests” in 2011, then re-took them this evening. The data are in the following table:

I wanted to see if there was a significant difference in the average “age of death” between 2011 and 2016, based on what information I gave these tests. Here, n = 8. Set α = 0.05.
H0: µ2011 = µ2016 (or µ2011 – µ2016 = 0)
Ha: µ2011 ≠ µ2016 (or µ2011 – µ2016 ≠ 0)
Computations:
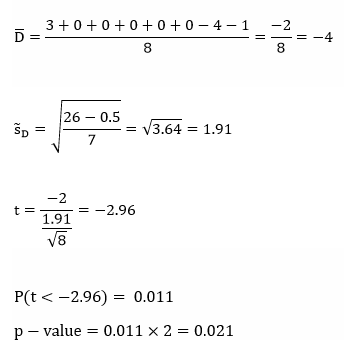
Since our p-value is smaller than our alpha-level, we reject H0 and claim that the population means are significantly different (with evidence in favor of the mean being higher in 2011).
Example in R
dat=read.table('clipboard',header=T) #"dat" is the name of the imported raw data

diffs = y2011 - y2016

n=length(diffs)

D = sum(diffs)

sdev = sd(diffs)

t = D/(sdev/sqrt(n))        #t score

pval = pt(t, n-1)*2         #p-value

                               #pt calculates the left-hand area

                               #multiply by two because it is a two-sided test
(Here’s a list of the tests, by the way.)

