Party all the time
(This is just an excuse to do a dinky little statistical analysis. Because I’m feeling analysis-deprived tonight.)
Long ago (2011) I took a series of online quizzes to figure out when the internet thought my average age of death was (which is a super valid prediction method, right?). Because I’m bored and have no life whatsoever, I’ve decided to re-take those same quizzes today and see if there is a statistically significant difference in the mean age of my death according to the internet.
GO!
The Data:
Year2011 year2015
86       87
70       67
79       79
90       84
89       89
85       85
91       90
85       85
Method: Since this is me just repeating a bunch of tests I’d taken before, this calls for a paired t-test!
H0: there is no difference in the means for 2011 and 2015
Ha: there is a difference in the means for 2011 and 2015
Results: The difference of the sample means is 1.125. With t = 1.3864, p-value = 0.282, we do not have significant evidence to reject the null hypothesis that there is no difference in the means for 2011 and 2015
Basic conclusion: My average lifespan (according to the internet) has neither increased nor decreased since 2011.
The end.
Sorry I’m so boring.
“Trompe l’oeil” is a fantastic phrase
HEY FOOLIOS!
So I’ve always had this suspicion that, on average, grades are better in the spring semesters than in the fall.
And because I’m an idiot, I didn’t find this until just now.
So let’s do some analyses!
The U of I has data from fall 2003 until fall 2013. I decided to use the “all student average” value for my analysis, and I also decided to do a paired means test where the “pairs” were made up of the average for the fall semester paired with the average for the following spring semester. Since most students start in any given fall semester and graduate in any given spring semester, it made the most sense to thing of fall-spring sets, since a fall semester and the following spring semester would most likely be made up of most of the same students, at least in comparison to any other pairing.
Also, there are a total of 10 pairs, so the sample size is OBSCENELY SMALL, but I’m doing it anyway.
Here we go!
Hypothesis: the average GPA for a year of UI students will be lower in the fall than in the spring. In other words, µfall < µspring.
Method: averages were collected for all spring and fall semesters between fall 2003 and spring 2012. Fall and subsequent spring semesters were paired.
Analysis: a paired t-test was performed on the 10 pairs of data and the above hypothesis was tested at an α = .05 level.
Results: here’s the table!
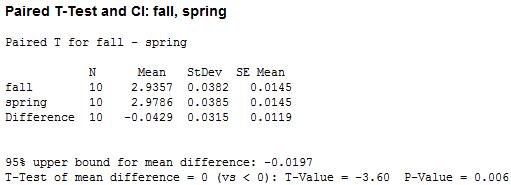
We’ve got a small p-value! That suggests, at a .05 level, that we can reject the hypothesis that the average GPA in fall and spring are equal and conclude in favor of the hypothesis that average GPA is lower in the fall than in the spring.

WOO!

