Stats from the Past
While digging through the book bin at the recycling center, I came across this awesome find:
It’s a stats book from 1951!
It was really interesting looking through this, ‘cause this book was published way before SPSS, SAS, R, or any other software (at least, any other stats-centric software) was readily available.
Thus, we get examples in which all the calculations are done using the formulas rather than being read from an output table. Here’s some regression:

And t-scores:

And of course the t-table (in graphical format):
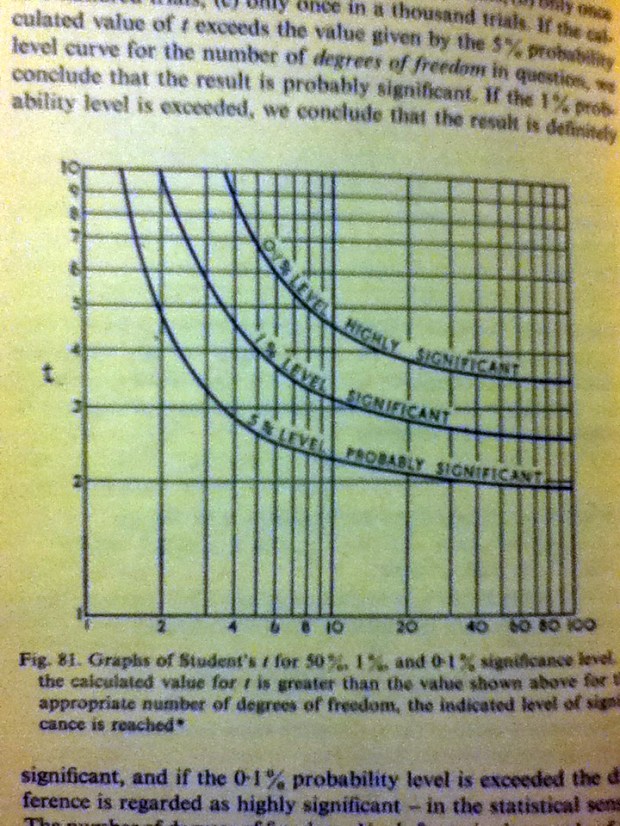
I didn’t even teach how to read a t-table in STAT 251. It was mainly because we just didn’t have time to do so, but considering we have ALL THE SOFTWARE today and, for all practical purposes, that’s what people use in “real life” nowadays, I focused instead on how to read output (and how to appropriately interpret it, of course!). I did have a separate sheet on how to understand a t-table that students could check out on their own if they wanted.
I’d show you pics of the ANOVA calculations, but there are a lot of them, haha.
DONE!

