LOOK WHAT I MADE LOOK
Want to see my pretty? Or part of it?
This is the spreadsheet.

Here’s what it looks like when I select DAISY as the file type.

Here’s what it looks like when I select .epub as the file type.

Like two days ago, I had no idea you could do this in Excel. Excel has gained a whole new level of respect from me. Not that it cares.
(In my head, Excel is the most arrogant of the Microsoft Office products)
The obsessive part of me wants to now go back and fix the code for this so that it’s not six billion lines long.So that might have to happen soon.
Haha, sorry, I’m excited.
END!
I…
Just taught myself how to write macros in Excel. A lot of them. In like two hours. It was fantastic.
I basically figured out how to do what I was trying to do in R in Excel. It’s actually a lot easier to implement in Excel, especially since (I totally just learned this, pardon my beginner’s excitement) you can create a hyperlink in a cell that links to another cell within the same spreadsheet. Totally had no idea you could do that.
But now I can do stuff in Visual Basic. Woot.
Okay, that’s all.
My life
What do most people do when they’re bored? Sleep? Watch TV? Mess around on the internet?
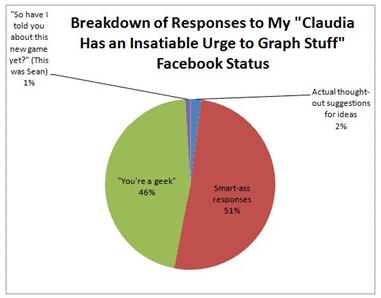
What do I do when I’m bored? I make stupid graphs in Excel while simultaneously ranting about how stupid Excel is. Did you know that it MESSES WITH YOUR PERCENTAGES if, when you’re making a pie chart, your percentages don’t add up to 100%? I mean, I guess it kind of has to change your data, ‘cause otherwise a pie chart would not work, but still.
But it doesn’t do it evenly! I was experimenting with this and had data with percentages of 3, 2, 2, and 1. The three percent and the one percent were different, obviously, when Excel changed the values, but the two two percents were different from each other! By a lot, too, not just a percentage point.
What the hell, Excel?
Oh, here are my stupid graphs. Enjoy.