Yo! Today we’re going to talk about another nonparametric test: the Wilcoxon matched-pairs signed-ranks test!
When Would You Use It?
The Wilcoxon matched-pairs signed-ranks test is a nonparametric test used to determine if two dependent samples represent two different populations.
What Type of Data?
The Wilcoxon matched-pairs signed-ranks test requires ordinal data.
Test Assumptions
- The sample of subjects has been randomly selected from the population it represents.
- The original scores obtained for the subjects in the study are interval or ratio data.
- The distribution of the difference of the scores in the populations represented by the samples is symmetric about the median population difference score.
Test Process
Step 1: Formulate the null and alternative hypotheses. The null hypothesis states that in the two populations represented by the two samples, the median difference score between the two populations is zero. The alternative hypothesis claims otherwise (that the population median difference is greater than, less than, or simply not equal to zero).
Step 2: Compute the test statistic. The test statistic here is called the Wilcoxon T test statistic. Since the calculation is best demonstrated with data, please see the example shown below to see how this is done.
Step 3: Obtain the critical value. Unlike most of the tests we’ve done so far, you don’t get a precise p-value when computing the results here. Rather, you calculate your T test statistic value and then compare it to a specific value. This is done using a table (such as the one here). Find the number at the intersection of your sample size and the specified α-level. Compare this value with your T value.
Step 4: Determine the conclusion. If the calculated T value is larger than the table value, fail to reject the null hypothesis (that is, retain the claim that the samples do not represent different populations). If the calculated T value is equal to or smaller than the table value, reject the null hypothesis in favor of the alternative.
Example
The example for today’s test comes from one of the STAT 213 lab sections I taught last semester. I wanted to see if the students’ ranks in relation to their lab peers changed between midterm 1 and midterm 2. Set α = 0.05. The data is summarized in the following table, and an explanation of the columns can be found below.
H0: θD = 0
Ha: θD ≠ 0

Column 1 is the student ID.
Column 2 is the student’s ranks on midterm 1, with “1” corresponding to the student with the highest grade and “23” corresponding to the student with the lowest grade.
Column 3 is the student’s ranks on midterm 2, with “1” corresponding to the student with the highest grade and “23” corresponding to the student with the lowest grade.
Column 4 is the differences between the rank on midterm 1 and the rank on midterm 2.
Column 5 is the absolute values of Column 4.
Column 6 is the ranks of the values in Column 5. If a Column 5 value is zero, it is not ranked. If there are multiple identical values in Column 5, the average of their ranks is assigned to each of those values for Column 6.
Column 7 is the signed ranks of the values in Column 5. It is the same as Column 6, except if a value was negative in Column 4, its rank becomes negative in Column 7.
To obtain the Wilcoxon T test statistic, find the sum of the positive signed ranks and the sum of the negative signed ranks (all in Column 7). The absolute value of the smaller of these sums is the Wilcoxon T. Here,
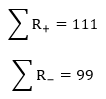
So T = 99. The table value for a two-tailed test with n = 23 and α = 0.05 is 73. Since our calculated T is larger than the critical value, we fail to reject the null hypothesis and claim that the median difference in rank in the population is not different between midterm 1 and midterm 2.
Example in R
No R example this week, as this is probably easier to do by hand.

