What do most people do when they’re bored? Sleep? Watch TV? Mess around on the internet?
What do I do when I’m bored? I make stupid graphs in Excel while simultaneously ranting about how stupid Excel is. Did you know that it MESSES WITH YOUR PERCENTAGES if, when you’re making a pie chart, your percentages don’t add up to 100%? I mean, I guess it kind of has to change your data, ‘cause otherwise a pie chart would not work, but still.
But it doesn’t do it evenly! I was experimenting with this and had data with percentages of 3, 2, 2, and 1. The three percent and the one percent were different, obviously, when Excel changed the values, but the two two percents were different from each other! By a lot, too, not just a percentage point.
What the hell, Excel?
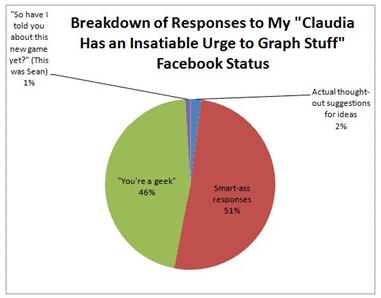
Oh, here are my stupid graphs. Enjoy.