Claudia: Demolishing Sanity One Blog at a Time
So I was dicking around with drawing ideas this evening and eventually started thinking about something cool to do with the zodiac signs. I was scribbling Aquarius’ sign everywhere when I considered how similar it looks to the “approximately equals” sign.
Which led to this:
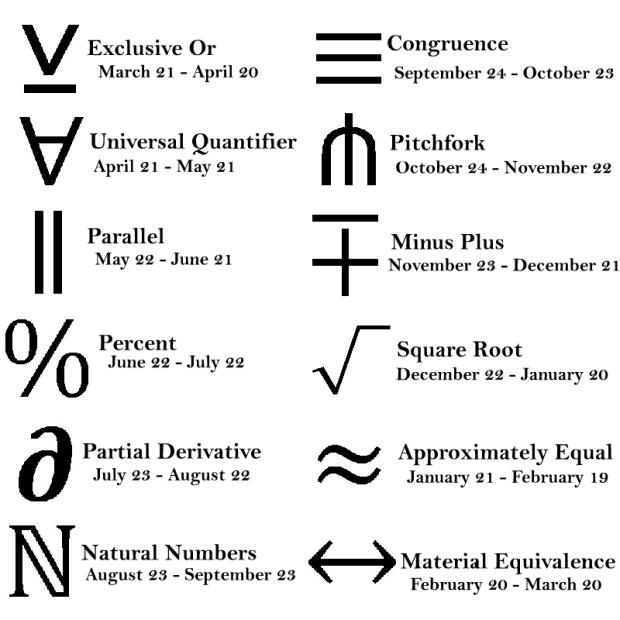
I wanted to find commonly-used math symbols that best matched the shape of the actual zodiac symbols to give you MATH ZODIAC, but for some of them I had to take a little artistic license. Virgo and Scorpio, I’m looking at you (yes, I just took Virgo’s “M” shape and made it an “N,” deal with it).
And for those of you screaming, “hey u cant mix mathz with pseudoscience SHAME lolz,” I say, “screw you.” Plus, now instead of saying “Taurus” when people ask you your sign, now you can reply “Universal Quantifier!” and confuse the hell out of them. Upturned A’s are cooler than bulls anyway.
Also, as I was waking up this morning, I swear I was trying to explain Euler’s Identity to my cat. Not sure how successful I was considering I was half asleep and she’s a cat.
THE SLOPE! THE SLOPE! THE SLOPE IS ON FIRE!
(Yeah, I’ve pretty much given up on my titles.)
So here’s a question that you may or may not have pondered: when we write the slope-intercept equation for a line, the m in y= mx + b is our slope, right?
Why the heck do we denote it with “m”?
There’s quite a range of theories.
According to Pat from Pats’blog, the word “slope” itself is derived from the Latin root slupan for “slip.” Which makes sense when you think of what the slope actually is.
A common myth is that Descartes first used m because it was the first letter of some French word related to slope, but according to a bunch of people who speak French (and we should probably trust them about their language) the appropriate word for slope is “pente.”
Pat digs up some info from Jeff Miller, who claims that the earliest use of m dates back to 1844 when Brit Matthew O’Brien wrote “A Treatise on Plane Co-Ordinate Geometry” and Irish George Salmon published “A Treatise on Conic Sections.”
Another possibility was pointed out by John Conway, who suggested that m could stand for “modulus of slope.”
But in the end, no one’s really sure exactly when and why we got to using m for slope. I’m sure there are a fair number of mathematical symbols we use that don’t have a clear origin, but I know I’ve never really thought about m for slope before. I guess that’s because when I first learned y = mx + b I always thought m was appropriate because if you follow the trace of the letter the slope changes a whole bunch.
I was a dumb kid.
This Week’s Science Blog: The Fast and the Fourier
http://www.sixtysymbols.com/index.html
Why I haven’t featured this as a TWSB yet, I don’t know.
But it’s happening now, so be happy!
Those frequenters of YouTube out in my readership (all two of you!) have probably come across one of the videos from the Sixty Symbols gang.
Run out of the University of Nottingham, the scientists behind Sixty Symbols seek to explain some of the coolest symbols used in physics and astronomy. They’ve got more than sixty symbols total right now because they’re working on a second set, so that’s even cooler.
Some of my favorites include:
– Planck Length
– Summation
– Star Classification
– Large Numbers
– Lambda (eigenvalues!!)
– Brazil Nut Effect
– Imaginary Numbers
– Kelvin (Kelvin needs more love in the temperature world)
Woo, science!
Greek letters as broken down by meanings in Statistics: a subjective and torturous endeavor
Included are only the letters I’ve used often…not kappa or zeta or anything else that often just stands for a random variable.
Least scary to scariest. Go!
μ
Good old population mean…you never let us down. The first moment, the best moment, the easiest moment.
π
Proportions! I like proportions. They can be tricky sometimes, but overall they’re pretty basic.
ε
Error! You don’t really ever have to calculate this…you just have to account for it and/or make sure it’s not correlated with anything else.
ρ
Rho! Correlation! Reliability! Looks almost exactly like a p when you write it in print! I like correlation. Correlation is easy and unthreatening, assuming you know what its limitations are.
α
Type I error, level of significance, or Chronbach’s alpha, a measure of reliability. Not too scary on it’s own, but can be confusing when mixed with small beta.
σ
Oh look, it’s the population standard deviation. Hello, population standard deviation. Small sigma isn’t really anything else ever (except standard error, but that’s fairly similar conceptually)…square it and you get variance…that’s about it.
τ
Kendall’s tau, another correlation coefficient. It’s nonparametric, which makes it awesome. Also, since it’s nonparametric, it’s easy to calculate.
β
Itty bitty beta! Regression coefficients, Type II error, or beta distribution for Bayesian insanity. It’s good if you can interpret it, scary if you can’t.
η
Effect size! Easy when you’re just screwing around with means and normal distributions, but a really big pain when you have to deal with itty bitty delta as well.
χ
Oh god, the chi-square distribution…what fun that is. Usually used for ANOVA-related purposes, and ANOVA is evil. The distribution itself is kinda cool, though.
ω
Weights or lengths of vectors…it can be either one! Flashbacks to Multivariate Analysis where we had to make orthogonal vectors of various lengths.
δ
Noncentrality parameter is noncentral (haha, sorry, I had to). This thing is scary as hell to deal with when you’re trying to make confidence intervals, especially when you have to use a different noncentrality parameter for each bound.
λ
OH GOD OH GOD EIGENVALUES HOLY HELL!
ALSO: happy birthday to Sean!
Today’s song: Who Wants to Live Forever by Queen

