52!
I’ve said this before and I’ll say it again: humans have a hard time with scale, either at the very large end or the very small end.
Example: 52!. How incomprehensibly large is that value? Here’s a video demonstrating what 52! seconds would be:
That’s insane. Insane.
The Recamán Sequence
This is super cool, yo.
Well, at least I’m consistent.
Hey, doods.
Back in 2012, I took an Approximate Number System aptitude test that I found online.
Then, in 2014, I took it again to see if my score had changed (since I’d done so much more math between 2012 and 2014 than I had prior to 2012). My score didn’t change at all.
So it’s 2016 now…wanna guess what I did?
I took it again!
And my score is still the same!
2012

2014

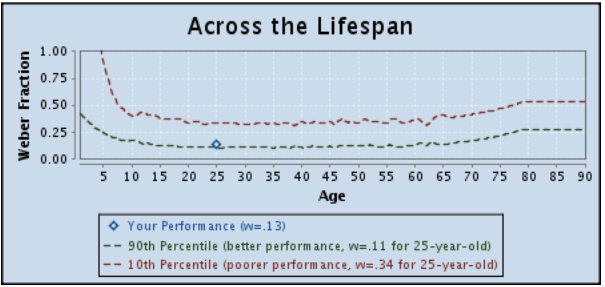
2016

Yeah. I guess the amount of math/numbers I deal with doesn’t affect how good I am at this test. Pretty cool result, though, nonetheless.
RESPECT THE TRIANGLE
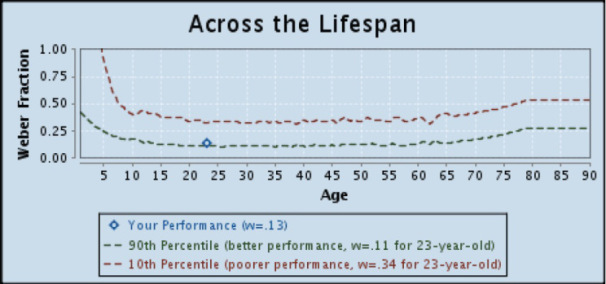
So remember this Approximate Number System aptitude test I did back in 2012? I decided to try it again. I’ve been doing so much more math since then, I wondered if that would affect my performance at all.
Results:
OLD (2012)
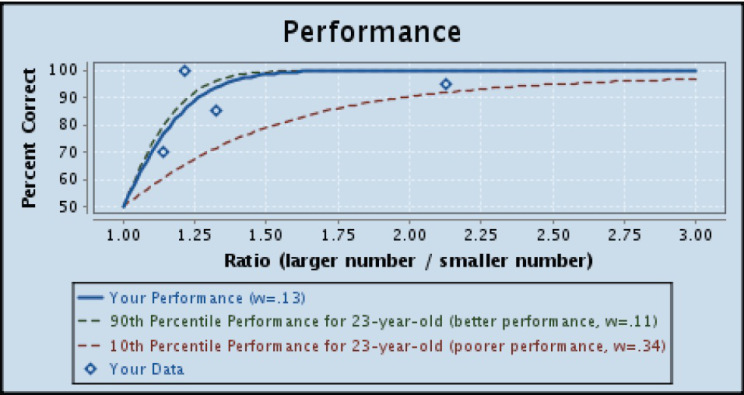

NEW (today)
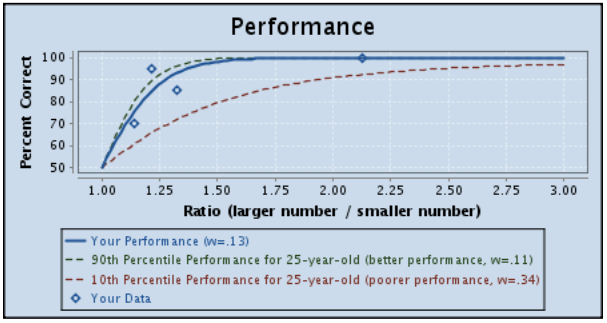

HAHA, nope. My Weber fraction (w = .13) is exactly the same. That’s hilarious.
Though to be fair, it’s 4:30 in the morning and I’m kinda hyper, so maybe that’s affecting stuff.
But I’m always like that, so maybe not.
WOOOOOOOOOOOOOOOOOOOOOOOOOOO!
Zzzz…
So I pretty much constantly dream about math/numbers now. And what’s frustrating is that it always seems like I’m coming up with these super awesome theories/proofs and then by the time the morning comes I can only remember fragments of them. They’re probably trivial and nonsensical, but it’d be nice to actually see if the stuff my REM-brain’s coming up with is coherent. At least, more coherent than my waking thoughts.
There’s a way you can train yourself to remember your dreams, right?
Are all Aquarian baseball players pitchers?
Holy crap dudes, this is the best discussion of imaginary numbers I’ve ever heard. Listen to this, it’s really cool.
ParaLOLogram
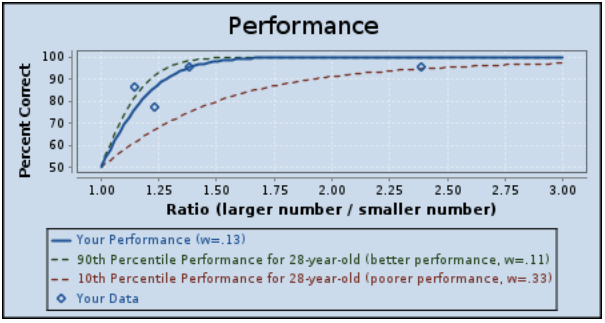
Approximate Number System aptitude!
I don’t remember how/when I found this, but it’s an interesting little test of your ability to determine quantity ratios.
Combinations of blue and yellow circles are shown to you, each for a fraction of a second, and you have to choose which there are more of—blue circles or yellow circles. They call this ability your “gut number sense” and good performance on the test is apparently correlated with good math performance in school.
My results:


Lower Weber fraction = better gut number sense.
I don’t remember if I liked math in elementary school, but I was pretty good at it. I was one of three in my sixth grade class in the advanced math “class” (aka, me and two dudes in a broom closet. All of us with dorky math nicknames. Go St. Mary’s.), and I was pretty good throughout junior high except for Algebra I (though I’m 90% sure my issues in that class stemmed from the fact that I missed a very crucial week due to my grandpa getting sick and my family having to spend a week in Seattle for his hospital stay). I stopped taking high school math after Algebra II ‘cause the teacher was a jerk and I would have had him for both trig and calc.
Also, I had stopped caring about school at that point.
But, as in every other area, there is a difference between ability and effort. So who knows.
Take it, it’s fun!
This Week’s Science Blog: Prime Suspects
Okay, so this is a result of my efforts to complete “Partying with the Primes: Part II” (see this blog for explanation. Or just scroll down a few days). Because I knew trying to get R to output some sort of number spiral would be quite an arduous task, I first decided to do a few more elementary visualizations of the primes. My first attempt led to today’s science blog.
Question: is there any sort of pattern to the spacing of prime numbers? That is, is there any sort of predictive sequence that demonstrates that the primes are “evenly spaced” (or not) amongst the other numbers?
I’d done a little bit of research on this topic prior to today, due to my 2009 NaNo (haha, we keep coming back to that, don’t we?), but it had been awhile, so I did a little bit more reading and came up with a few good sources to check out: here, here, and here.
Specifically, Zagier’s comment stood out to me: “there are two facts about the distribution of prime numbers of which I hope to convince you so overwhelmingly that they will be permanently engraved in your hearts. The first is that, despite their simple definition and role as the building blocks of the natural numbers, the prime numbers grow like weeds among the natural numbers, seeming to obey no other law than that of chance, and nobody can predict where the next one will sprout. The second fact is even more astonishing, for it states just the opposite: that the prime numbers exhibit stunning regularity, that there are laws governing their behavior, and that they obey these laws with almost military precision.”
So what’s a good way to visualize this stuff? My first attempt involved coding all prime numbers as “1” and all non-prime numbers as “0” and then plotting the results with 0 and 1 on the y-axis and the actual numbers (1 through whatever the highest number I chose was…I think it was 1,000), but that was a horrible mess of jagged lines and insanity, so I scrapped that and tried to think of a better way of looking at it.
In the end, I decided the best way to examine the instances of prime numbers amongst the non-primes was to plot the numbers by the numbers themselves. That is, for a given sequence of numbers (say, 1 through 10, just to make the explanation simpler) I would repeat each number by that number itself, create a new vector containing these numbers, and then plot the result.
Defunct code for better understanding:
RepPrime=function(j) {
return (rep(j,j))
}
This function says that for any number j in a given set of numbers (again, let’s say 1:10), output that number j times. So if I had the number 7, this function would give me a vector [7 7 7 7 7 7 7]’, or 7 repeated seven times. And if I ran it for all numbers 1 through 10, I’d get the vector
[1 2 2 3 3 3 4 4 4 4 5 5 5 5 5 6 6 6 6 6 6 7 7 7 7 7 7 7 8 8 8 8 8 8 8 8 9 9 9 9 9 9 9 9 9 10 10 10 10 10 10 10 10 10 10]’.
Of course, I couldn’t get this function to work but after screwing around a little bit more I finally figured out how to get this to work for larger sets of numbers, including sets just containing primes.
But what would plotting vectors like this reveal about any prevalence patterns for the primes? Well, let’s look at the plot for all numbers, shall we?
This plot is for all numbers from 1 to 1,000.

It’s pretty! Nice and smooth. So this can be said to be a plot for numbers that have a uniform or consistent pattern (all instances in this case occur one number apart, just because there’s one number difference between each instance; such is the nature of just listing the numbers 1 through 1,000).
Okay, that’s cool. So how about we look at a case where instances occur more “randomly?” In this case, I took a list of the numbers 1 through 1,000 and then went through and haphazardly deleted single numbers or large chunks of numbers so that I was left with a list that appeared to have numbers omitted at random.
Plot!

Much choppier, eh? This can be said, then, to be a plot pattern for numbers that have an inconsistent or random pattern of deletion.
So what would a plot of the primes—say, all the primes below 5,000—look like?
THIS!

So it’s obvious that this plot looks a lot more like the plot for numbers 1:1,000 and less like the plot involving random deletion. Interesting…I’d like to see what goes on with much larger primes, but unfortunately I can’t do that due to how huge the resulting vectors would be. R + large datasets = trouble.
Woo!
Wiggity Wiggity Wiggity BLOG
I FREAKING LOVE this stuff. Especially since patterns like this were big parts of my NaNo.
Yay. :)
“We have reached critical mass, captain!”
What’s up with this? Everything’s coming to a milestone lately. “Lately” meaning in the last week, especially today. Here’s a little timeline for y’all:
-I reach 300 blog posts (February 24th)
-I reach 100 (101, actually) wall posts on Aneel’s Facebook (February 25th)
-I reach 100 wall posts on my Facebook (yesterday, thanks Matt!)
-I reach 1,000 profile views (today)
-I reach 3,000 blog views (today, and right now we’re at 3,012)
-I reach 1,000 songs on my iPod (today)
-I reach my 9-month MySpace anniversary (tomorrow, assuming I don’t die in the meantime)
Like I said, what’s up with this? It’s like some cosmic syzygy, only on earth and without planets lining up.
Or something like that.

