Men’s figure skating is the best Olympic event
Hey, it’s Winter Olympics time! That means it’s time to bring up this video again for any poor souls who haven’t seen it yet.
Johnny Weir is awesome.
Also, Plushenko. Because Plushenko.
Nnnnf.
More Figure Skating
Aw, this was so sad to watch.
I hope he didn’t cause any more permanent damage to his back during the team skates.
Edit (2/22): okay, wow, so it sounds like he needs back surgery again because one of the screws already in his spine snapped. Ouch.
GAMES
There is no better way to start an Olympic games than with this man:
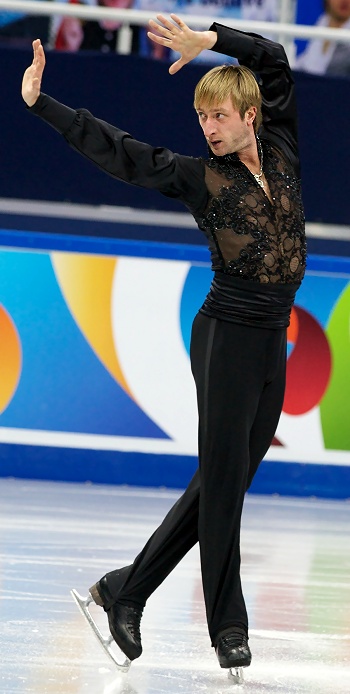
Evgeni Plushenko!!!
And that was a damn good program he gave us tonight, holy crap.
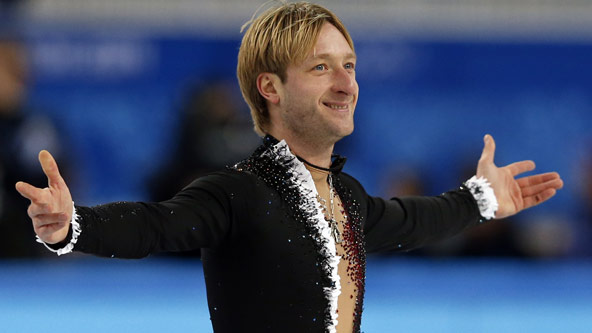
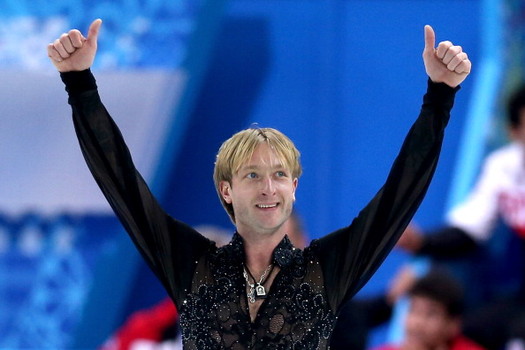
Have some more pics:

The fact that I was in the same city as him–for a few days, at least–makes me super happy.
(I love him sorry)
In other news (and the reason that this blog is password protected), my STAT 452 class is really starting to suck. I definitely need to rant about this—which will happen later when I have more time and am not absorbed in watching figure skating—but I just needed to mention it somewhere before my head explodes from anger.
Multicollinearity: The Silent Killer
Warning: this whole blog is like a stats orgy for me, but if you’re not into that, feel free to skip.
OKAY, so…last week for my Measurement homework, we were told to analyze data taken from the VANCOUVER 2010 OLYMPIC MALE FIGURE SKATING JUDGING!!!! Yeah, I was super happy.
Anyway, so since the only thing we really looked at was reliability between the judges and the components, I decided to screw around with it more this afternoon. Very quickly, my little fun turned into an exercise of how multicollinearity can destroy an analysis.
First, a brief explanation of the data (which can be found RIGHT HERE). The dataset contains vectors of the skaters’ names, the country they’re from, the total Technical score (which is made up of the scores the skaters earned on jumps), the total Component score, and the five subscales of the Component score (Skating Skills, Transitions, Performance/Execution, Choreography, and Interpretation).
So the first thing I did was find out the correlations between the five subscales. The way the data were initially presented gave the subscale scores broken up by the nine judges (so 45 columns), but since the reliability of the judges was so high, I felt it appropriate to collapse the judges’ ratings into the average judge scores for each subscale. So here’s the correlation matrix:
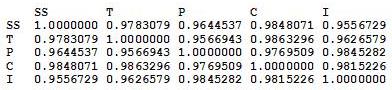
From this, it’s pretty apparent how related these subscales are.
AND NOW THE REGRESSION!

Here I’m predicting the total Composite score from the five subscales. Intuitively, these subscale coefficients should all be significant, right? Since the Composite score is, you know, entirely dependent on all of them.
Well, if we try this out, we get no significance at the .05 level FOR ALL SUBSCALES.
That’s right, the very variables that CREATE the Composite score don’t explain ANY significant amount of variance in it!
But why, you ask? (And I know you’re asking it!)
MULTICOLLINEARITY!
Regression coefficients are numbers that explain the change in the dependent variable for every unit change in the corresponding independent variable. For example, if the regression coefficient for Skating Skills was 3.52, then we would expect that for every unit change in Skating Skills, the Composite score would increase 3.52 units. Well, how are regression coefficients interpreted? As the amount of change in the dependent variable that can be explained by a single independent variable while holding the other variables constant.
That last part is the most important, and requires a picture.
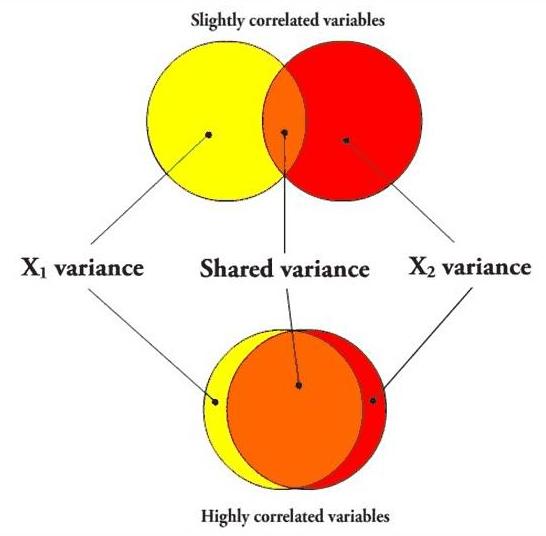
In the first case, if I’m going to predict a variable using X1, the variance that overlaps with X2 (the orange part) will be partialled out when creating the regression coefficient, since X2 is being held constant. However, since the variables aren’t very correlated, there is still a lot of “influence” (the yellow area, independent of X2) that X1 can have on the predictor variable when X2 is held constant.
However, in the second case, the overlapping orange part is huge, leaving only a small sliver of yellow. In other words, when two predictor variables are highly correlated, partialling the second variable (X2) out in order to create the unique predictive power of the first variable (X1) practically removes the entirety of X1, leaving very little influence left over, so even if X1 were highly predictive of the dependent variable, it most likely would not have a significant regression coefficient.
Here’s a picture using the five subscales as the independent variables.
The entire gray area is the amount of the explained variance that gets “covered up” due to the variables all being highly correlated. The colored components are the amount of each independent variable that actually gets to be examined per each regression coefficient. This lack of variance exhibited by each of these little slivers basically causes the independent variables to look insignificant in the amount of variance they explain in the dependent variable.
Another good test for multicollinearity issues is the tolerance. The multiple R2 (in this case, .9926) is the amount of variance in the Composite score that all these variables together predict. Tolerance is 1 – R2, and is 0.0074 in this case. Any tolerance lower than 0.20 is usually an indicator of multicollinearity.
So yeah. How cool is that?
When I do the regression for each subscale predicting the Component score individually, they’re all highly significant (p < 0.001).
MULTICOLLINEARITY DESTROYS REGRESSION ANALYSES!
Yeah.
This made me really happy.
And yes, this was, in my opinion, and excellent use of the afternoon.
Today’s song: Red Alert by Basement Jaxx
MEN’S FIGURE SKATING = BEST THING EVER
Haha, I like how I left Vancouver and now I’m at home watching the Olympics on TV. Funny.
Men’s figure skating is my favorite event. Always has been.
And JOHNNY WEIR’S BACK! I FREAKING LOVE Johnny Weir. Why? Example:
SO sexy. Words cannot describe. The fact that he’s skating to Lady GaGa doesn’t help.
Also, Evgeni Plushenko is gorgeous. Haha, sorry, I need a boyfriend.
Today’s song: Mr. Pitiful by Matt Costa

