Deconstructing Pi
Today I did something fun (and something that crashed SAS at least 10 times): I decided to deconstruct pi to the 1 millionth digit. Why? I wanted to see if the numbers 0-9 appeared nearly uniformly throughout this fraction of such an infinitely long number. I wanted to test the hypothesis that a large enough sample size with the instances seemingly “random” would produce a much less leptokurtic (bell curve-shaped) distribution.
I also like the word “pi.”
STEP BY STEP PROCESS!
First I went here to get the first million digits.
Then I used the handy-dandy CTRL-H “find and replace” command to put spaces behind each digit so that SAS could read each one as a distinct piece of datum.
So after SAS crashing on me like 4 billion times (it took awhile to be able to input the most amount of data but not have it flip out—no seriously, this took like three hours), I finally got all the data into SAS and analyzed it. Here are codes/output!
As you all know, the mean of numbers 0-9 is 4.5. When n=1,000,000,the mean of all this data is 4.499934, about as close to 4.5 as you can get. And there’s practically no skewness, either.
Here’s the bar chart:

And, appropriately, here’s the pie chart:
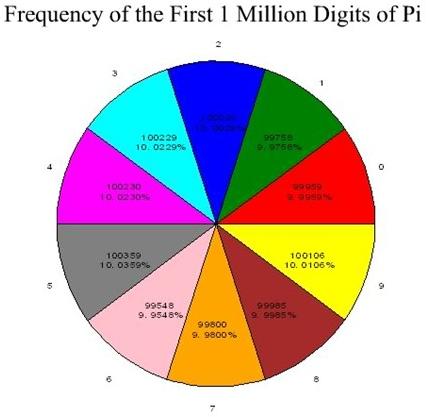
How freaking GORGEOUS is that uniformity?! I mean, LOOK at it!
Breakdown by smallest to largest frequency:
6: 99,548
1: 99,758
7: 99,800
0: 99,959
8: 99,985
2: 100,026
9: 100,106
3: 100,229
4: 100,230 (ONE instance difference between digits 3 and 4! OMG!)
5: 100,359
The power of the large sample size, my friend. Cherish it. Admire it. Worship it.
I’m done here.

