Pi vs. e
So a couple days ago I blogged about why I hadn’t ever analyzed e the same way I had analyzed pi awhile back.And today I said to myself, “hey you idiot, what’s your malfunction? Just break up the million digits into chunks, summarize the numbers within, and then combine all the info in an R-friendly table?”
Yeah, what a genius, eh? Proof that any moron can get a Master’s degree.
(Haha, holy hell, I have a Master’s degree. I think that’s the first time I’ve ever written that.)
Anyway.
So I found a list of the first 1 million digits of e here, broke the list into 10 sections of 100,000 digits, summarized the frequencies, made a fancy-shmancy table, plugged it into R, and did an analysis like the one I did to pi. Specifically, I wanted to see exactly how uniform the distribution of digits were in a number with a non-repeating decimal.
Rather than just showing you the results from e (and to have an excuse to screw around with R graphics), I drudged up the data from my pi analysis so I can present to you a few side-by-side comparisons.
Off we go! And as always, pictures are clickable for fullsize.
Here is a table of the digit frequencies, or how often each number (0 through 9) occurred within the first million digits of the two irrational numbers. Since the distribution of these digits is presumably uniform, the expected frequency for each digit is 100,000. As you can see, there’s a slight deviation from this because my sample size is comparatively very tiny.

Cool, huh? And here are comparative pie charts, which aren’t useful at all because the differences in frequencies—both within and across the two irrationals—are so small compared to the number of digits overall. But they were fun to make and they’re pretty, so you get them anyway.


Here’s a better graphic to show a comparison of the frequencies. Number of instances on the y-axis, digits on the x-axis. The red lines/points represent frequencies for e, the blue lines/points represent frequencies for pi. Look at 6. Isn’t that weird how it’s the most frequent digit in e but the least frequent in pi? And check out 3. There was only one more instance of a 3 in the first million digits of pi than there was in the first million digits of e.

How cool, eh?
MATHEMATICS!
Deconstructing Pi
Today I did something fun (and something that crashed SAS at least 10 times): I decided to deconstruct pi to the 1 millionth digit. Why? I wanted to see if the numbers 0-9 appeared nearly uniformly throughout this fraction of such an infinitely long number. I wanted to test the hypothesis that a large enough sample size with the instances seemingly “random” would produce a much less leptokurtic (bell curve-shaped) distribution.
I also like the word “pi.”
STEP BY STEP PROCESS!
First I went here to get the first million digits.
Then I used the handy-dandy CTRL-H “find and replace” command to put spaces behind each digit so that SAS could read each one as a distinct piece of datum.
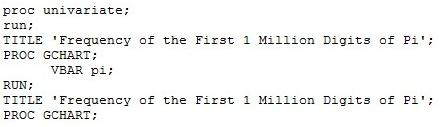
So after SAS crashing on me like 4 billion times (it took awhile to be able to input the most amount of data but not have it flip out—no seriously, this took like three hours), I finally got all the data into SAS and analyzed it. Here are codes/output!
As you all know, the mean of numbers 0-9 is 4.5. When n=1,000,000,the mean of all this data is 4.499934, about as close to 4.5 as you can get. And there’s practically no skewness, either.
Here’s the bar chart:

And, appropriately, here’s the pie chart:
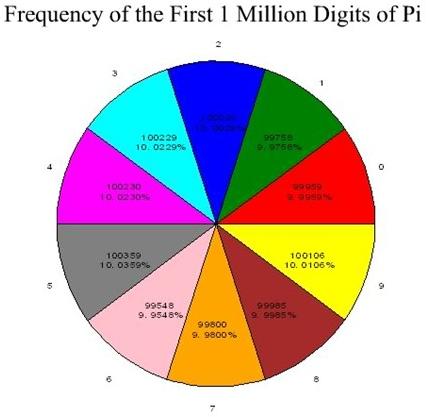
How freaking GORGEOUS is that uniformity?! I mean, LOOK at it!
Breakdown by smallest to largest frequency:
6: 99,548
1: 99,758
7: 99,800
0: 99,959
8: 99,985
2: 100,026
9: 100,106
3: 100,229
4: 100,230 (ONE instance difference between digits 3 and 4! OMG!)
5: 100,359
The power of the large sample size, my friend. Cherish it. Admire it. Worship it.
I’m done here.

