NEEEEEEEEEEEERDS! (Actually, Skittles)
Today I found this blog post, which is a follow-up to another blog post talking about how many bags of Skittles would need to be observed before two identical packs (same number of candies, same color distribution) were discovered.
In this follow-up post, the author also looks at the overall distribution of the colors across the packs and finds the following:

(Image from here)
They remark: “The most common and controversial question asked about Skittles seems to be whether all five flavors are indeed uniformly distributed…I leave it to an interested reader to consider and analyze whether this departure from uniformity is significant.”
Well, I am an interested reader, so here we go.
We’re going to test the claim that the flavors* are uniformly distributed (by stating that the proportions of each of these five flavors are equal) against the claim that the flavors are not uniformly distributed (by stating that at least one proportion differs from the others).

Let’s use p-value = 0.05.
The author has graciously made their data available to the public, so I snagged it up and got the following information:

Applying a chi-square goodness-of-fit test, we get the following results:

Since our p-value of 0.001 < 0.05, we reject H0 and conclude that at least one of the above proportions differs from the expected 0.20 under the null hypothesis. This means that statistically, the proportions are significantly different.
…I should be getting stuff ready for the end of the semester. Or working on my NaNo. Why did I do this?
*I’m using color rather than flavor, since a) “red” is easier to type than “strawberry” and b) candy flavors such as these are MEANINGLESS TO MY BROKEN NOSE
Week 8: The Chi-Square Goodness-of-Fit Test
Today we’re continuing the theme of nonparametric tests with the chi-square goodness-of-fit test!
When Would You Use It?
The chi-square goodness-of-fit test is a nonparametric test used in a single sample situation to determine if a sample originates from a population for which the observed cell (category) frequencies different from the expected cell (category) frequencies. Basically, this test is used when a particular “distribution” is expected of the categories of a variable and a researcher wants to know if that distribution fits the data.
What Type of Data?
The chi-square goodness-of-fit test requires categorical (nominal) data.
Test Assumptions
- Categorical or nominal data are used in the analysis (the data should represent frequencies for mutually exclusive categories).
- The data consist of a random sample of n observations.
- The expected frequency (as calculated below) of each cell is 5 or greater.
Test Process
Step 1: Formulate the null and alternative hypotheses. The null hypothesis claims that the observed frequency of each cell is equal to the expected frequency of that cell, while the alternative hypothesis claims that at least one cell has an observed frequency that differs from the expected frequency.
Step 2: Compute the test statistic, a chi-square value. The calculations are as follows:
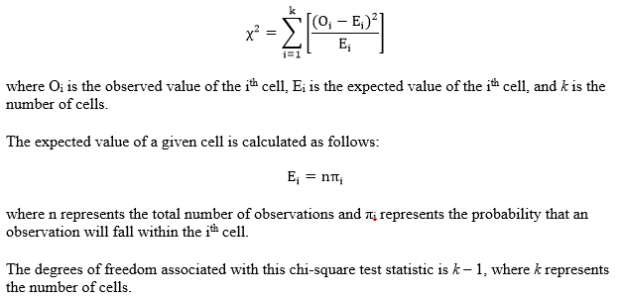
Step 3: Obtain the p-value associated with the calculated chi-square. The p-value indicates the probability of observing deviations from the expected values that are larger than those in the observed sample, under the assumption that the null hypothesis is true.
Step 4: Determine the conclusion. If the p-value is larger than the prespecified α-level, fail to reject the null hypothesis (that is, retain the claim that the observed frequencies in the cells are equal to the expected frequencies of the cells). If the p-value is smaller than the prespecified α-level, reject the null hypothesis in favor of the alternative.
Example
For this test’s example, I wanted to determine if the dice on my iPod Yahtzee app were fair. That is, I wanted to see if there was an equal probability for all six sides to come up on any given roll. So I rolled the five dice 115 times (for a total of n = 575 individual die rolls) and simply recorded the faces showing (note that I did not actually “play” Yahtzee while doing this, which is to say that I just kept rolling all five dice no matter what happened and I didn’t “hold” any of them at any point). I’m going to claim in my null hypothesis that all six side values have an equal probability of showing on a given die. That is,
H0: p1 = p2 = p3 = p4 = p5 = p6 = 1/6
Ha: The probability for at least one value is not 1/6
Set α = 0.05.
Computations:

Since our p-value is larger than our alpha level of .05, we fail to reject H0 and claim that the observed values are equal to the expected values and the dice are fair.
Example in R
x=read.table('clipboard', header=F)
n=length(x)
tab=as.data.frame(table(x))           #observed frequencies
p=1/length(tab$x)
Chi=rep(NaN,length(tab$x))
for (i in 1:length(tab$x)){
Chi[i]=((tab$Freq[i]-(p*n))^2)/(p*n)
}
Chisquare=sum(Chi)
1-pchisq(Chisquare,length(tab$x)-1)   #p-value

