A Visual Explanation of Analysis of Variance (ANOVA)
HOKAY GUYZ. We’re doing ANOVA in two of the lab sessions I’m running. I like explaining ANOVA because it’s something that might seem complicated/difficult if you look at all the equations involved but is actually a pretty intuitive procedure. Back when I taught my class at the U of I, I always preferred to explain it visually first and then look at the math, just because it really is something that’s easier to understand with a visual (like a lot of things in statistics, really).
So that’s what I’m going to do in today’s blog!
The first confusing thing about ANOVA is its name: analysis of variance. The reason this is confusing is because ANOVA is actually a test to determine if a set of three or more means are significantly different from one another. For example, suppose you have three different species of iris* and you want to determine if there is a significant difference in the mean petal lengths for these three species.
“But then why isn’t it called “analysis of means?” you ask.
Because ANOME is a weird acronym
Because—get this—we actually analyze variances to determine if there are differences in means!
BUT HOW?
Keep reading. It’s pretty cool.
Let’s look at our iris example. The three species are versicolor, virginica, and setosa. Here I’ve plotted 50 petal lengths for each species (150 flowers total). The mean for each group is marked with a vertical black line. Just looking at this plot, would you suspect there is a significant difference amongst the means (meaning at least two of the means are statistically significantly different)? It looks like the mean petal lengths of virginica and versicolor are similar, but setosa’s kind of hanging out there on its own. So maybe there’s a difference.

Well, ANOVA will let us test it for sure!
Like the name implies, ANOVA involves looking at the variance of a sample. What’s special about ANOVA, though, is the way it looks at the variance of a sample. Specifically, it breaks it down into two sources: “within-groups” variance and “between-groups” variance. I’ll keep using our iris sample to demonstrate these.
Within-groups variance is just as it sounds—it’s the variation of the values within each of the groups in the sample. Here, our groups are the three species, and our within-groups variance is a measure of how much the petal length varies within each species sample. I’ve taken the original plot and changed it so that the within-groups variance is represented here:

You can think of the sum of the lengths of these colored lines as your total within-groups variance for our sample.**
What about between-groups variance? Well, it’s pretty much just what it sounds like as well. It’s essentially the variance between the means of the groups in the sample. Here I’ve marked the three species means and drawn black line segments between the different means. You can think of the sum of the lengths of these black lines as your total between-groups variance for the sample:
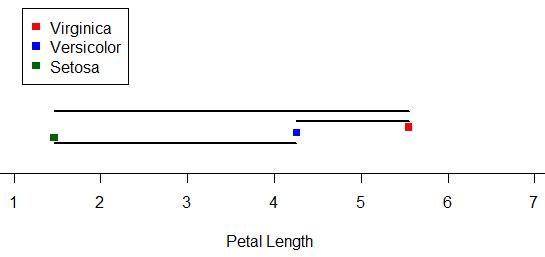
ALRIGHTY, so those are our two sources of variance. Looking at those two, which do you think we’d be more interested in if we were looking for differences amongst the means? Answer: between-groups variance! We’re less concerned about the variance around the individual means and more concerned with the variance between the means. The larger our between-groups variance is, the more evidence we have to support the claim that our means are different.
However, we still have to take into account the within-groups variance. Even though we don’t really care about it, it is a source of variance as well, so we need to deal with it. So how do we do that? We actually look at a ratio: a ratio of our between-groups variance to our within-groups variance.
In the context of ANOVA, this ratio is our F-statistic.*** The larger the F-statistic is, the more the between-groups variance—the variance we’re interested in—contributes to the overall variance of the sample. The smaller the F-statistic, the less the between-groups variance contributes to the overall variance of the sample.
It makes sense, then, that the larger the F-statistic, the more evidence we have to suggest that the means of the groups in the sample are different.

Above are the length-based loose representations of our between- and within-groups variances for our iris data. Notice that our between-groups variance is longer (and thus larger). Is is larger enough for there to be a statistically significant difference amongst the means? Well, since this demo can only go so far, we’d have to do an actual ANOVA to answer that.
(I’m going to do an actual ANOVA.)
Haha, well, our F = 1180, which is REALLY huge. For those of you who know what p-values are, the p-value is like 0.0000000000000001 or something. Really tiny. Which means that yes, there is a statistically significant difference in the means of petal length by species in this sample.
Brief summary: we use variance to analyze the similarity of sample means (in order to make inferences about the populatoin means) by dividing variance into two source: within-groups variance and between-groups variance. Taking a ratio of these two sources, the larger the ratio is, the more evidence there is to suggest that the variation between groups is great–which in turn suggests the means are different.
Anyway. Hopefully this gave a little bit more insight to the process, at least, even if it wasn’t a perfectly accurate description of how the variances are exactly calculated. I still think visualizing it like this is easier to understand than just looking at the formulae.
*Actual data originally from Sir Ronald Fisher.
**That’s not exactly how it works, but close enough for this demo.
***I won’t go much into this here, either, just so I don’t have to explain the F distribution and all that jazz. Just think of the F-statistic as a basic ratio of variances for now.

