Today it’s time for yet another test: the z test for a population proportion!
When Would You Use It?
The z test for a population proportion is used to determine if, in an underlying population comprised of two categories, the proportion of observations (in a sample) in one of the two categories is equal to a specific value.
What Type of Data?
The z test for a population proportion requires categorical (nominal) data.
Test Assumptions
- Each of the n independent observations is randomly selected from a population, and each observation can be classified into one of two mutually exclusive categories.
- It is recommended that this test is employed when the sample is not too small (n > 11).
Test Process
Step 1: Formulate the null and alternative hypotheses. The null hypothesis claims that the likelihood an observation will fall into Category 1 in the population is equal to a certain probability. The alternative hypothesis claims otherwise (that the population proportion for Category 1 is not equal to the value stated in the null).
Step 2: Compute the test statistic, a z-score. The test statistic is computed as follows:
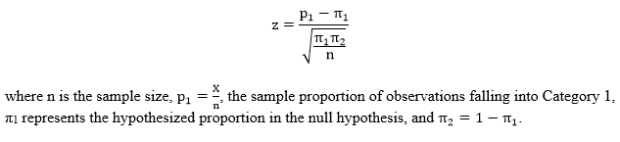
Step 3: Obtain the p-value associated with the calculated z-score. The p-value indicates the probability of observing a sample proportion as extreme or more extreme than the observed sample proportion, under the assumption that the null hypothesis is true.
Step 4: Determine the conclusion. If the p-value is larger than the prespecified α-level, fail to reject the null hypothesis (that is, retain the claim that the probability of falling into Category 1 in the population is equal to the value specified in the null hypothesis). If the p-value is smaller than the prespecified α-level, reject the null hypothesis in favor of the alternative.
Example
The data for this example come from my n = 30 students from one of my STAT 213 labs. I want to test the hypothesis, based on my lab, that the proportion of students who come to lab for ALL the 213 labs (for this particular instructor) is 40%. We take attendance, so we know who’s there and who’s not for a given week (note, however, that I’m going to randomly select an attendance sheet from one of the weeks of lab, AND I actually never pay attention to what the proportion of students who show up is, so I’m really just guessing about 40%). So let’s do it! Set α = 0.05 and let π denote the proportion of individuals to come to lab.
H0: π = .4
Ha: π ≠ .4
Computations:

Since our p-value is (only slightly) larger than our alpha-level, we fail to reject H0 and claim that the population proportion of students who attend labs is, in fact, .4.
Example in R
dat = read.table('clipboard',header=F) #'dat' is the name of the imported raw data
                                       #'dat' coded such that 0 = did not attend, 1 = attended
n = nrow(dat)
X = sum(dat)
p1 =  X/n
pi1 = .4
z = (p1-pi1)/(sqrt((pi1*(1-pi1))/n))  #z-score
pval = (1-pnorm(z))*2                 #p-value
                                      #pnorm calculates the left-hand area
                                      #multiply by two because it is a two-sided test

