Today we’re going to move away from testing for means and do the single-sample chi-square test for a population variance!
When Would You Use It?
The chi-square test is a parametric test used in a single sample situation to determine if a sample originates from a population with a specific variance σ2.
What Type of Data?
The chi-square test for variance requires interval or ratio data.
Test Assumptions
- The sample is a simple random sample from the population of interest.
- The distribution underlying the data is normal.
Test Process
Step 1: Formulate the null and alternative hypotheses. The null hypothesis claims that the variance in the population is equal to a specific value; the alternative hypothesis claims otherwise (the population variance is greater than, less than, or not equal to the value specified in the null hypothesis.
Step 2: Compute the chi-square value. The chi-square value is computed as follows:

Step 3: Obtain the p-value associated with the calculated chi-square. The p-value indicates the probability of observing a sample variance as extreme or more extreme than the observed sample variance, under the assumption that the null hypothesis is true.
Step 4: Determine the conclusion. If the p-value is larger than the prespecified α-level, fail to reject the null hypothesis (that is, retain the claim that the variance in the population is equal to the value specified in the null hypothesis). If the p-value is smaller than the prespecified α-level, reject the null hypothesis in favor of the alternative.
Example
The data for this example come from my n = 365 song downloads from 2010. I want to create a hypothesis test regarding the variance of the song lengths (in seconds). I have no idea what the variance is, but I’m going to say that I suspect the variance to be (120)2, or two minutes squared. Set α = 0.05
H0: σ2 = 14,400 seconds
Ha: σ2 ≠ 14,440 seconds
The sample variance is calculated to be 12182.44.
Computations:
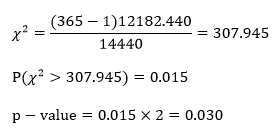
Since our p-value is smaller than our alpha-level, we reject H0 and claim that the population variance is greater than (120)2 seconds.
Example in R
dat=read.table('clipboard',header=T) #'dat' is the name of the imported raw data
sigma = 120^2
s = var(dat)
n = 365
chisq = ((n-1)*s)/(sigma)  #chi-square value
pval = (pchisq(chisq, n-1))*2    #p-value
                                 #n-1 is the degrees of freedom

