Week 1: The Single-Sample z Test
Today we’ll be discussing one of the most commonly used statistical tests and one of the first ones taught in introductory stats: the single-sample z test!
When Would You Use It?
The single-sample z test is a parametric test used in a single sample situation to determine if the sample originates from a population with a specific mean µ. This test is used when the population standard deviation, σ, is known.
What Type of Data?
The single-sample z test requires interval or ratio data.
Test Assumptions
- The sample is a simple random sample from the population of interest.
- The distribution underlying the data is normal.
Test Process
Step 1: Formulate the null and alternative hypotheses. The null hypothesis claims that the mean in the population is equal to a specific value; the alternative hypothesis claims otherwise (the population mean is greater than, less than, or not equal to the value specified in the null hypothesis.
Step 2: Compute the z-score. The z-score is computed as follows:
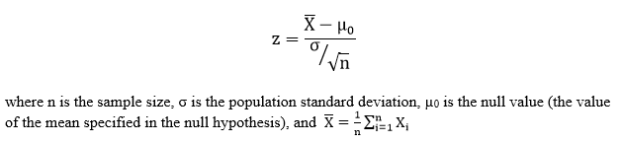
Step 3: Obtain the p-value associated with the calculated z-score. The p-value indicates the probability of observing a sample mean as extreme or more extreme than the observed sample mean, under the assumption that the null hypothesis is true.
Step 4: Determine the conclusion. If the p-value is larger than the prespecified α-level, fail to reject the null hypothesis (that is, retain the claim that the mean in the population is equal to the value specified in the null hypothesis). If the p-value is smaller than the prespecified α-level, reject the null hypothesis in favor of the alternative.
Example
The data for this example are n = 400 IQ scores from random sample of individuals ages 18 to 87. The test used to obtain the scores was constructed similar to the Stanford-Binet IQ test, meaning that we can assume that the average IQ score in the population should be 100 and the population standard deviation σ is known and is equal to 15. Let’s test the claim that the population mean is actually different than 100. Set α = 0.05.
H0: µ = 100
Ha: µ ≠ 100
The sample mean is calculated to be 101.864
Computations:
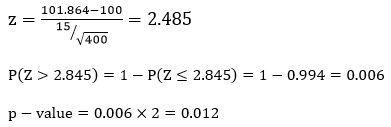
Since our p-value is smaller than our alpha-level (0.012 > 0.05), we reject H0 and claim that the population mean is different from 100.
Example in R
dat=read.table('clipboard',header=T) #'dat' is the name of the imported raw data
mu = 100
sigma = 15
n = 400
xbar = mean(dat)
z = (xbar-mu)/(sigma/sqrt(n))  #z-score
pval = (1-pnorm(z))*2          #p-value
                               #pnorm calculates the left-hand area
                               #multiply by two because it is a two-sided test

